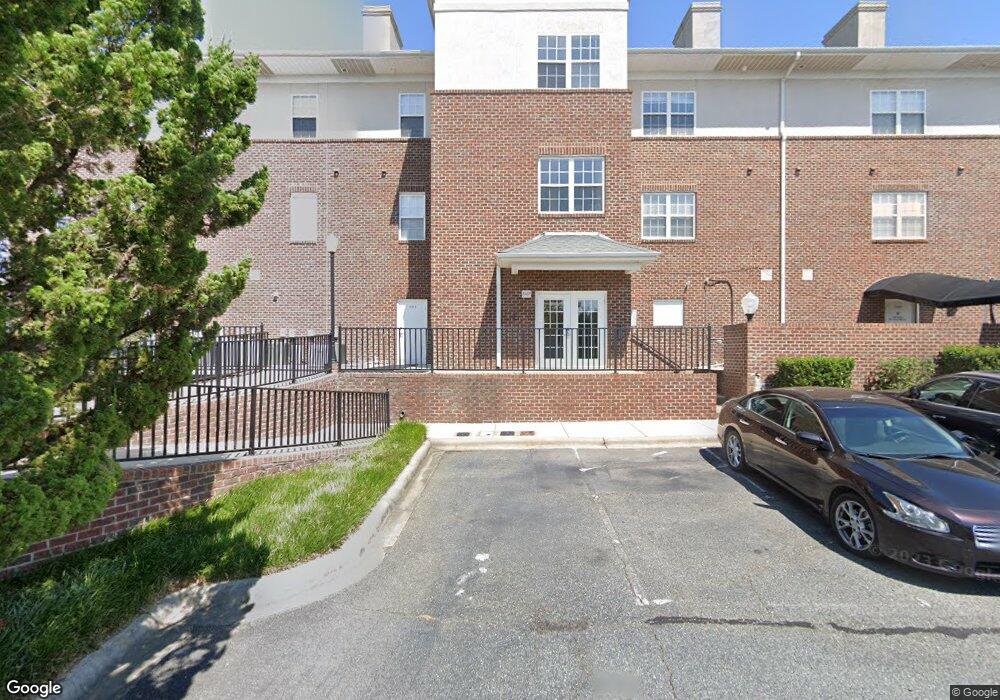
5425 Village Dr NW Unit 202 Concord, NC 28027
Estimated Value: $240,000 - $293,000
2
Beds
2
Baths
1,106
Sq Ft
$243/Sq Ft
Est. Value
About This Home
This home is located at 5425 Village Dr NW Unit 202, Concord, NC 28027 and is currently estimated at $268,929, approximately $243 per square foot. 5425 Village Dr NW Unit 202 is a home located in Cabarrus County with nearby schools including Charles E. Boger Elementary School, Northwest Cabarrus Middle School, and Cabarrus Charter Academy.
Ownership History
Date
Name
Owned For
Owner Type
Purchase Details
Closed on
Oct 28, 2021
Sold by
A & J Properties Llc
Bought by
Village Drive Llc
Current Estimated Value
Home Financials for this Owner
Home Financials are based on the most recent Mortgage that was taken out on this home.
Original Mortgage
$568,000
Outstanding Balance
$519,086
Interest Rate
2.8%
Mortgage Type
Future Advance Clause Open End Mortgage
Estimated Equity
-$250,157
Purchase Details
Closed on
Jan 3, 2020
Sold by
Falkenbury Catherine Lee
Bought by
Troutman Land Investments Inc
Purchase Details
Closed on
Feb 14, 2008
Sold by
Mayfield Lakeland Llc
Bought by
Rbav Llc
Purchase Details
Closed on
Sep 10, 2004
Sold by
Rbav Llc
Bought by
Hampy Carol A and Demarco Kimberly
Purchase Details
Closed on
May 10, 2004
Sold by
Mayfield Lakeland Llc
Bought by
Rbav Llc
Create a Home Valuation Report for This Property
The Home Valuation Report is an in-depth analysis detailing your home's value as well as a comparison with similar homes in the area
Home Values in the Area
Average Home Value in this Area
Purchase History
| Date | Buyer | Sale Price | Title Company |
|---|---|---|---|
| Village Drive Llc | $710,000 | None Available | |
| Troutman Land Investments Inc | $142,000 | None Available | |
| Rbav Llc | -- | None Available | |
| Hampy Carol A | $123,500 | Chicago Title Insurance Comp | |
| Rbav Llc | $700,000 | -- |
Source: Public Records
Mortgage History
| Date | Status | Borrower | Loan Amount |
|---|---|---|---|
| Open | Village Drive Llc | $568,000 |
Source: Public Records
Tax History Compared to Growth
Tax History
| Year | Tax Paid | Tax Assessment Tax Assessment Total Assessment is a certain percentage of the fair market value that is determined by local assessors to be the total taxable value of land and additions on the property. | Land | Improvement |
|---|---|---|---|---|
| 2025 | $2,596 | $260,650 | $59,400 | $201,250 |
| 2024 | $2,596 | $260,650 | $59,400 | $201,250 |
| 2023 | $1,875 | $153,650 | $38,500 | $115,150 |
| 2022 | $1,875 | $153,650 | $38,500 | $115,150 |
| 2021 | $1,875 | $153,650 | $38,500 | $115,150 |
| 2020 | $1,875 | $153,650 | $38,500 | $115,150 |
| 2019 | $1,787 | $146,510 | $34,100 | $112,410 |
| 2018 | $1,758 | $146,510 | $34,100 | $112,410 |
| 2017 | $1,729 | $146,510 | $34,100 | $112,410 |
| 2016 | $1,026 | $141,410 | $34,100 | $107,310 |
| 2015 | $1,669 | $141,410 | $34,100 | $107,310 |
| 2014 | $1,669 | $141,410 | $34,100 | $107,310 |
Source: Public Records
Map
Nearby Homes
- 5461 Ives St NW
- 5554 Village Dr NW
- 75 Mccurdy St NW Unit 75
- 5497 Coleman Cir NW
- 439 Beacon St NW
- 5505 Yorke St NW
- 5618 Burck Dr NW
- 4946 Grand Canyon Rd NW
- 6115 Village Dr NW
- 3430 Blackfield Ct
- 6119 Village Dr NW
- 5185 Grand Canyon Rd NW
- 4909 Charmwood Ct NW
- 551 Hemmings Place NW
- 561 Keystone Ct NW
- 648 Kannapolis Pkwy
- 557 Keystone Ct NW
- 2514 Mountain Laurel Ave NW
- 2504 Fallbrook Place NW
- 664 Summerford Ct NW
- 5425 Village Dr NW
- 5427 Village Dr NW
- 5423 Village Dr NW Unit 201
- 5445 Village Dr NW
- 5447 Village Dr NW Unit 303
- 5409 Village Dr NW Unit E
- 5443 Village Dr NW Unit 301
- 5443 Village Dr NW
- 5429 Village Dr NW
- 5419 Village Dr NW Unit G1
- 5419 Village Dr NW
- 5421 Village Dr NW
- 5441 Village Dr NW
- 5449 Village Dr NW Unit 304
- 5431 Village Dr NW
- 5451 Village Dr NW Unit 305
- 5433 Village Dr NW
- 5405 Village Dr NW Unit E
- 5405 Village Dr NW Unit 104
- 5453 Village Dr NW