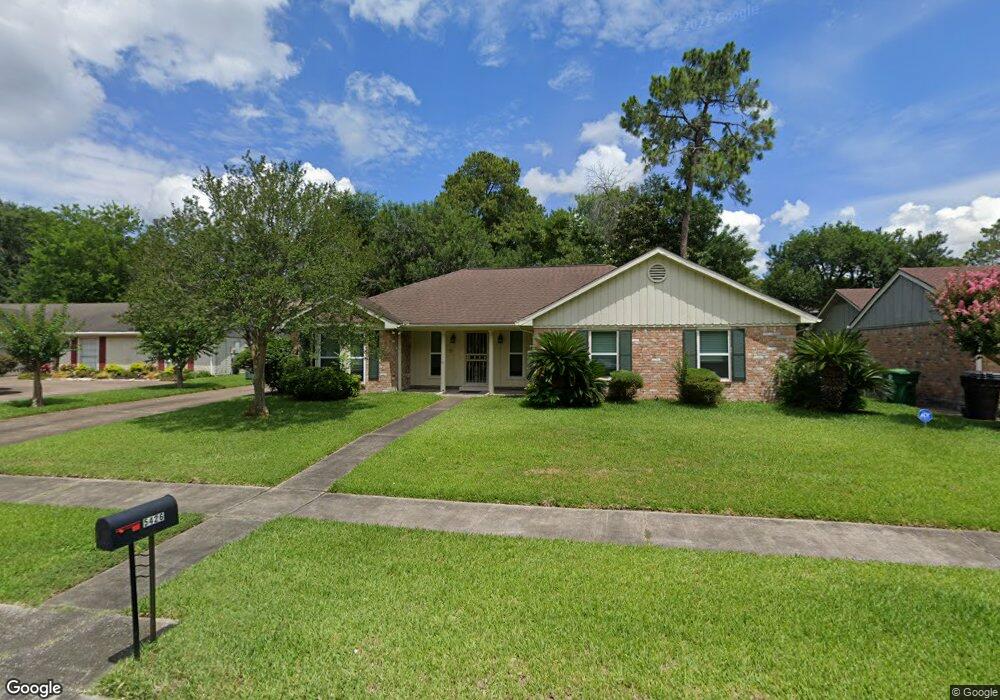
5426 Long Creek Ln Houston, TX 77088
Greater Inwood NeighborhoodEstimated Value: $233,000 - $248,000
3
Beds
2
Baths
1,945
Sq Ft
$125/Sq Ft
Est. Value
About This Home
This home is located at 5426 Long Creek Ln, Houston, TX 77088 and is currently estimated at $242,191, approximately $124 per square foot. 5426 Long Creek Ln is a home located in Harris County with nearby schools including Stovall School, Caraway Intermediate School, and Caraway Elementary School.
Ownership History
Date
Name
Owned For
Owner Type
Purchase Details
Closed on
May 22, 2015
Sold by
Bragg Johnny Elgie and Bragg Christi Cooper
Bought by
Clayton Kenneth N
Current Estimated Value
Purchase Details
Closed on
Apr 17, 2014
Sold by
Poenitzsch Jo Lyn
Bought by
Bragg Johnny Elgie and Bragg Christi Cooper
Home Financials for this Owner
Home Financials are based on the most recent Mortgage that was taken out on this home.
Original Mortgage
$109,800
Interest Rate
4.43%
Mortgage Type
New Conventional
Purchase Details
Closed on
Jul 3, 2012
Sold by
Estate Of David Peter Lage Jr
Bought by
Jacobson Clarence Dale
Purchase Details
Closed on
Aug 24, 2005
Sold by
Smith Paula Saizan
Bought by
Poenitzsch Jo Lyn
Home Financials for this Owner
Home Financials are based on the most recent Mortgage that was taken out on this home.
Original Mortgage
$12,700
Interest Rate
5.78%
Mortgage Type
Stand Alone Second
Create a Home Valuation Report for This Property
The Home Valuation Report is an in-depth analysis detailing your home's value as well as a comparison with similar homes in the area
Home Values in the Area
Average Home Value in this Area
Purchase History
| Date | Buyer | Sale Price | Title Company |
|---|---|---|---|
| Clayton Kenneth N | -- | Chicago Title | |
| Bragg Johnny Elgie | -- | None Available | |
| Jacobson Clarence Dale | -- | None Available | |
| Poenitzsch Jo Lyn | -- | Fidelity National Title |
Source: Public Records
Mortgage History
| Date | Status | Borrower | Loan Amount |
|---|---|---|---|
| Previous Owner | Bragg Johnny Elgie | $109,800 | |
| Previous Owner | Poenitzsch Jo Lyn | $12,700 | |
| Previous Owner | Poenitzsch Jo Lyn | $101,600 |
Source: Public Records
Tax History Compared to Growth
Tax History
| Year | Tax Paid | Tax Assessment Tax Assessment Total Assessment is a certain percentage of the fair market value that is determined by local assessors to be the total taxable value of land and additions on the property. | Land | Improvement |
|---|---|---|---|---|
| 2025 | $5,109 | $217,371 | $51,390 | $165,981 |
| 2024 | $5,109 | $225,122 | $51,390 | $173,732 |
| 2023 | $5,109 | $218,322 | $51,390 | $166,932 |
| 2022 | $5,211 | $217,235 | $51,390 | $165,845 |
| 2021 | $4,103 | $163,356 | $38,543 | $124,813 |
| 2020 | $4,486 | $169,957 | $38,543 | $131,414 |
| 2019 | $4,128 | $149,178 | $19,700 | $129,478 |
| 2018 | $2,011 | $140,047 | $19,700 | $120,347 |
| 2017 | $3,715 | $140,047 | $19,700 | $120,347 |
| 2016 | $3,432 | $129,375 | $19,700 | $109,675 |
| 2015 | $2,665 | $119,245 | $19,700 | $99,545 |
| 2014 | $2,665 | $100,139 | $19,700 | $80,439 |
Source: Public Records
Map
Nearby Homes
- 5514 Long Creek Ln
- 5606 Water Leaf Ln
- 5519 Council Grove Ln
- 5639 Council Grove Ln
- 5710 Council Grove Ln
- 4306 Saratoga Dr
- 4206 Saratoga Dr
- 7526 Antoine Dr
- 7611 Athlone Dr
- 4015 Black Locust Dr
- 5906 Lawn Ln
- 5914 Lawn Ln
- 7728 Challie Ln
- 0 Maple Hill Dr
- 4444 Victory Dr Unit 1311
- 4444 Victory Dr Unit 1108
- 7736 Challie Ln
- 0 Antoine Dr
- 7808 Inwood Grove Ln
- 5907 Darkwood Dr
- 5430 Long Creek Ln
- 5422 Long Creek Ln
- 5511 Moss Glenn Ln
- 5515 Moss Glenn Ln
- 5507 Moss Glenn Ln
- 5502 Long Creek Ln
- 5414 Long Creek Ln
- 5603 Moss Glenn Ln
- 5427 Long Creek Ln
- 5419 Long Creek Ln
- 5503 Moss Glenn Ln
- 5506 Long Creek Ln
- 5607 Moss Glenn Ln
- 5415 Long Creek Ln
- 5503 Long Creek Ln
- 5510 Moss Glenn Ln
- 5430 Bent Bough Ln
- 5514 Moss Glenn Ln
- 5426 Bent Bough Ln
- 5506 Moss Glenn Ln