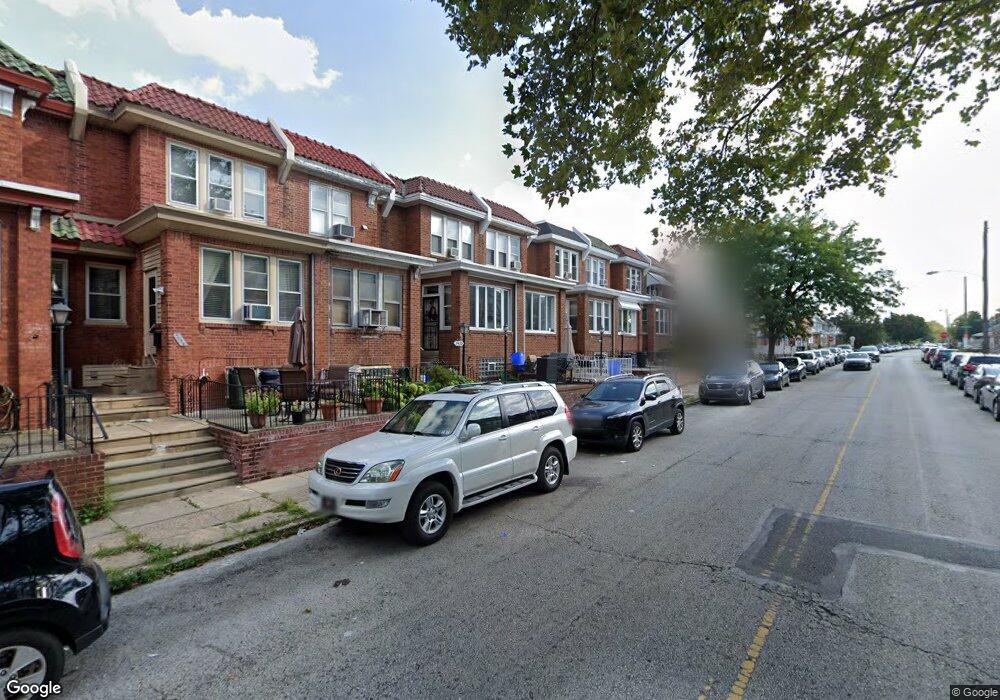
5427 Oakland St Philadelphia, PA 19124
Frankford NeighborhoodEstimated Value: $200,000 - $238,000
3
Beds
1
Bath
1,416
Sq Ft
$155/Sq Ft
Est. Value
About This Home
This home is located at 5427 Oakland St, Philadelphia, PA 19124 and is currently estimated at $219,394, approximately $154 per square foot. 5427 Oakland St is a home located in Philadelphia County with nearby schools including Frankford High School, The Philadelphia Charter School for the Arts & Sciences, and Mastery Schools Smedley Elementary.
Ownership History
Date
Name
Owned For
Owner Type
Purchase Details
Closed on
Nov 8, 2002
Sold by
Marano Ralph F and Marano Jean C
Bought by
Gill Lakita
Current Estimated Value
Home Financials for this Owner
Home Financials are based on the most recent Mortgage that was taken out on this home.
Original Mortgage
$59,430
Outstanding Balance
$24,916
Interest Rate
6.16%
Mortgage Type
FHA
Estimated Equity
$194,479
Create a Home Valuation Report for This Property
The Home Valuation Report is an in-depth analysis detailing your home's value as well as a comparison with similar homes in the area
Home Values in the Area
Average Home Value in this Area
Purchase History
| Date | Buyer | Sale Price | Title Company |
|---|---|---|---|
| Gill Lakita | $59,900 | -- |
Source: Public Records
Mortgage History
| Date | Status | Borrower | Loan Amount |
|---|---|---|---|
| Open | Gill Lakita | $59,430 |
Source: Public Records
Tax History Compared to Growth
Tax History
| Year | Tax Paid | Tax Assessment Tax Assessment Total Assessment is a certain percentage of the fair market value that is determined by local assessors to be the total taxable value of land and additions on the property. | Land | Improvement |
|---|---|---|---|---|
| 2026 | $2,082 | $180,400 | $36,080 | $144,320 |
| 2025 | $2,082 | $180,400 | $36,080 | $144,320 |
| 2024 | $2,082 | $180,400 | $36,080 | $144,320 |
| 2023 | $2,082 | $148,700 | $29,700 | $119,000 |
| 2022 | $943 | $103,700 | $29,700 | $74,000 |
| 2021 | $1,573 | $0 | $0 | $0 |
| 2020 | $1,573 | $0 | $0 | $0 |
| 2019 | $1,510 | $0 | $0 | $0 |
| 2018 | $959 | $0 | $0 | $0 |
| 2017 | $1,379 | $0 | $0 | $0 |
| 2016 | $959 | $0 | $0 | $0 |
| 2015 | $918 | $0 | $0 | $0 |
| 2014 | -- | $98,500 | $15,201 | $83,299 |
| 2012 | -- | $13,312 | $1,251 | $12,061 |
Source: Public Records
Map
Nearby Homes