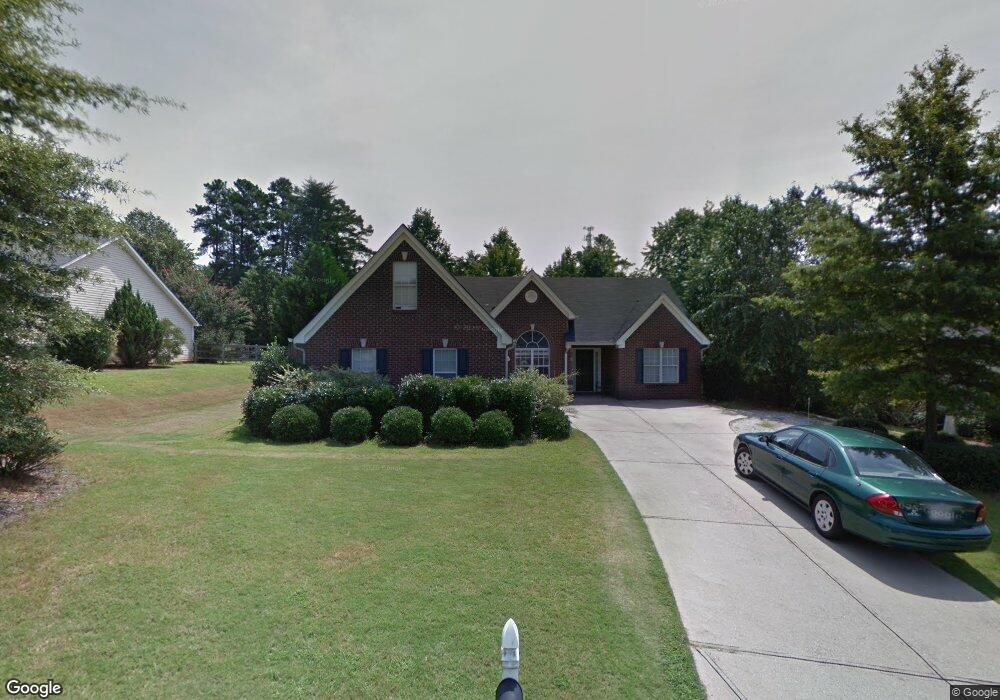
5427 Ohara Ln Flowery Branch, GA 30542
Estimated Value: $370,000 - $395,000
3
Beds
2
Baths
1,879
Sq Ft
$203/Sq Ft
Est. Value
About This Home
This home is located at 5427 Ohara Ln, Flowery Branch, GA 30542 and is currently estimated at $381,853, approximately $203 per square foot. 5427 Ohara Ln is a home located in Hall County with nearby schools including Friendship Elementary School, C.W. Davis Middle School, and Flowery Branch High School.
Ownership History
Date
Name
Owned For
Owner Type
Purchase Details
Closed on
Feb 12, 2001
Sold by
Torres Mauricio
Bought by
Torres Mauricio and Torres Graciela
Current Estimated Value
Purchase Details
Closed on
Aug 11, 2000
Sold by
Appco Enterprises Inc
Bought by
Torres Mauricio
Home Financials for this Owner
Home Financials are based on the most recent Mortgage that was taken out on this home.
Original Mortgage
$115,000
Interest Rate
8.17%
Mortgage Type
New Conventional
Purchase Details
Closed on
Nov 8, 1999
Sold by
R & M Developers Inc
Bought by
Appco Enterprises Inc
Home Financials for this Owner
Home Financials are based on the most recent Mortgage that was taken out on this home.
Original Mortgage
$112,500
Interest Rate
7.81%
Mortgage Type
New Conventional
Create a Home Valuation Report for This Property
The Home Valuation Report is an in-depth analysis detailing your home's value as well as a comparison with similar homes in the area
Home Values in the Area
Average Home Value in this Area
Purchase History
| Date | Buyer | Sale Price | Title Company |
|---|---|---|---|
| Torres Mauricio | -- | -- | |
| Torres Mauricio | $137,900 | -- | |
| Appco Enterprises Inc | $900,000 | -- |
Source: Public Records
Mortgage History
| Date | Status | Borrower | Loan Amount |
|---|---|---|---|
| Previous Owner | Torres Mauricio | $115,000 | |
| Previous Owner | Appco Enterprises Inc | $112,500 |
Source: Public Records
Tax History Compared to Growth
Tax History
| Year | Tax Paid | Tax Assessment Tax Assessment Total Assessment is a certain percentage of the fair market value that is determined by local assessors to be the total taxable value of land and additions on the property. | Land | Improvement |
|---|---|---|---|---|
| 2024 | $3,774 | $149,136 | $30,560 | $118,576 |
| 2023 | $3,223 | $142,496 | $30,560 | $111,936 |
| 2022 | $3,285 | $124,096 | $30,560 | $93,536 |
| 2021 | $2,670 | $98,376 | $16,320 | $82,056 |
| 2020 | $2,280 | $81,176 | $8,640 | $72,536 |
| 2019 | $2,155 | $75,896 | $8,640 | $67,256 |
| 2018 | $2,033 | $69,176 | $8,640 | $60,536 |
| 2017 | $1,908 | $65,496 | $8,640 | $56,856 |
| 2016 | $1,561 | $54,310 | $8,640 | $45,670 |
| 2015 | $1,568 | $54,310 | $8,640 | $45,670 |
| 2014 | $1,568 | $54,310 | $8,640 | $45,670 |
Source: Public Records
Map
Nearby Homes
- 6082 Hillsdale Cir
- 5361 Hog Mountain Rd
- 6307 Bluegrass Ln
- 6001 Devonshire Dr
- 5565 Hog Mountain Rd
- 6103 Portsmouth Dr
- 6104 Saddlehorse Dr
- 5415 Falls Landing Dr
- 5739 Boulder Ridge Ct
- 6201 Southport Dr
- 6306 Water Haven Way
- 6354 Brookridge Dr
- 5730 Boulder Ridge Ct
- 6775 Winding Canyon Rd
- 6651 Rivergreen Rd
- 5423 Ohara Ln
- 5431 Ohara Ln
- 5435 Ohara Ln
- 5417 Ohara Ln
- 5420 Ohara Ln
- 5424 Ohara Ln
- 5432 Ohara Ln
- 5411 Ohara Ln
- 5436 Ohara Ln
- 5416 Ohara Ln
- 5334 Peach Blossom Trail
- 5439 Ohara Ln
- 5440 Ohara Ln
- 5322 Peach Blossom Trail
- 5405 Ohara Ln
- 5318 Peach Blossom Trail
- 0 Ohara Ln Unit 7287948
- 0 Ohara Ln Unit 7195911
- 0 Ohara Ln Unit 8832741
- 0 Ohara Ln Unit 8828395