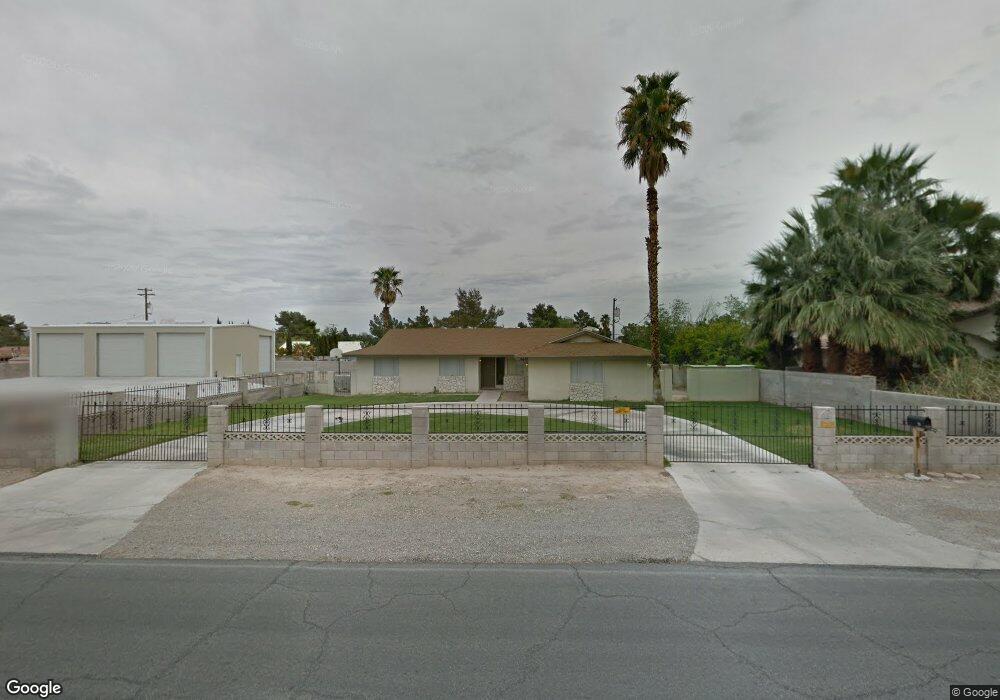
5428 Evaline St Las Vegas, NV 89120
Paradise Valley East NeighborhoodEstimated Value: $515,196 - $603,000
4
Beds
2
Baths
2,286
Sq Ft
$250/Sq Ft
Est. Value
About This Home
This home is located at 5428 Evaline St, Las Vegas, NV 89120 and is currently estimated at $571,549, approximately $250 per square foot. 5428 Evaline St is a home located in Clark County with nearby schools including Doris French Elementary School, Helen C. Cannon Junior High School, and Del Sol Academy of the Performing Arts.
Ownership History
Date
Name
Owned For
Owner Type
Purchase Details
Closed on
Feb 19, 2003
Sold by
Ks Nevada Inc
Bought by
Doke George G and Doke Patricia D
Current Estimated Value
Home Financials for this Owner
Home Financials are based on the most recent Mortgage that was taken out on this home.
Original Mortgage
$240,000
Outstanding Balance
$102,336
Interest Rate
5.89%
Estimated Equity
$469,213
Purchase Details
Closed on
Aug 4, 2000
Sold by
Charmakin Ltd
Bought by
Hartwell Nina and The Nina Hartwell Trust
Purchase Details
Closed on
Feb 11, 1999
Sold by
Margulis Gordon J and Margulis Helen L
Bought by
Charmakin Ltd
Purchase Details
Closed on
Jun 26, 1998
Sold by
Monroe Ltd
Bought by
Margulis Gordon J and Margulis Helen L
Purchase Details
Closed on
May 12, 1998
Sold by
Kinn Mary E
Bought by
Charmakin Ltd
Create a Home Valuation Report for This Property
The Home Valuation Report is an in-depth analysis detailing your home's value as well as a comparison with similar homes in the area
Home Values in the Area
Average Home Value in this Area
Purchase History
| Date | Buyer | Sale Price | Title Company |
|---|---|---|---|
| Doke George G | $300,000 | National Title Company | |
| Hartwell Nina | $250,000 | Nevada Title Company | |
| Charmakin Ltd | $26,500 | -- | |
| Margulis Gordon J | $40,000 | -- | |
| Charmakin Ltd | -- | -- |
Source: Public Records
Mortgage History
| Date | Status | Borrower | Loan Amount |
|---|---|---|---|
| Open | Doke George G | $240,000 |
Source: Public Records
Tax History Compared to Growth
Tax History
| Year | Tax Paid | Tax Assessment Tax Assessment Total Assessment is a certain percentage of the fair market value that is determined by local assessors to be the total taxable value of land and additions on the property. | Land | Improvement |
|---|---|---|---|---|
| 2025 | $1,232 | $80,305 | $49,140 | $31,165 |
| 2024 | $1,196 | $80,305 | $49,140 | $31,165 |
| 2023 | $1,196 | $72,505 | $44,363 | $28,142 |
| 2022 | $1,162 | $69,560 | $44,363 | $25,197 |
| 2021 | $1,128 | $60,948 | $37,538 | $23,410 |
| 2020 | $1,092 | $58,441 | $35,718 | $22,723 |
| 2019 | $1,060 | $51,947 | $30,030 | $21,917 |
| 2018 | $1,029 | $47,899 | $27,300 | $20,599 |
| 2017 | $1,400 | $47,729 | $27,300 | $20,429 |
| 2016 | $976 | $35,748 | $16,153 | $19,595 |
| 2015 | $973 | $32,181 | $12,058 | $20,123 |
| 2014 | $944 | $36,144 | $15,243 | $20,901 |
Source: Public Records
Map
Nearby Homes
- 2486 Leigh Ave
- 5473 S Eastern Ave
- 5433 Latigo St
- 5328 Topaz St
- 5473 Clydesdale St
- 2184 Sunnyslope Ave
- 2186 Rawhide St
- 2917 Chapala Dr
- 2297 Casey Dr
- 2166 Roan Ave
- 2302 Wagonwheel Ave
- 2988 Chapala Dr
- 2625 E Russell Rd
- 2880 Casey Dr
- 2885 Horseshoe Dr
- 5399 Surrey St
- 2246 E Russell Rd
- 2410 Paradise Village Way
- 2454 Paradise Village Way
- 3023 Chapala Dr
- 5462 Evaline St
- 5429 Carruth St
- 5419 Carruth St
- 5463 Carruth St
- 5392 Evaline St
- 5459 Evaline St
- 5425 Evaline St
- 5496 Evaline St
- 2515 Leigh Ave
- 5487 Carruth St
- 5391 Evaline St
- 5428 Carruth St
- 5462 Carruth St
- 5460 S Eastern Ave
- 5497 Carruth St
- 5472 Carruth St
- 5503 Evaline St
- 2555 Leigh Ave
- 2472 Leigh Ave
- 5496 Carruth St