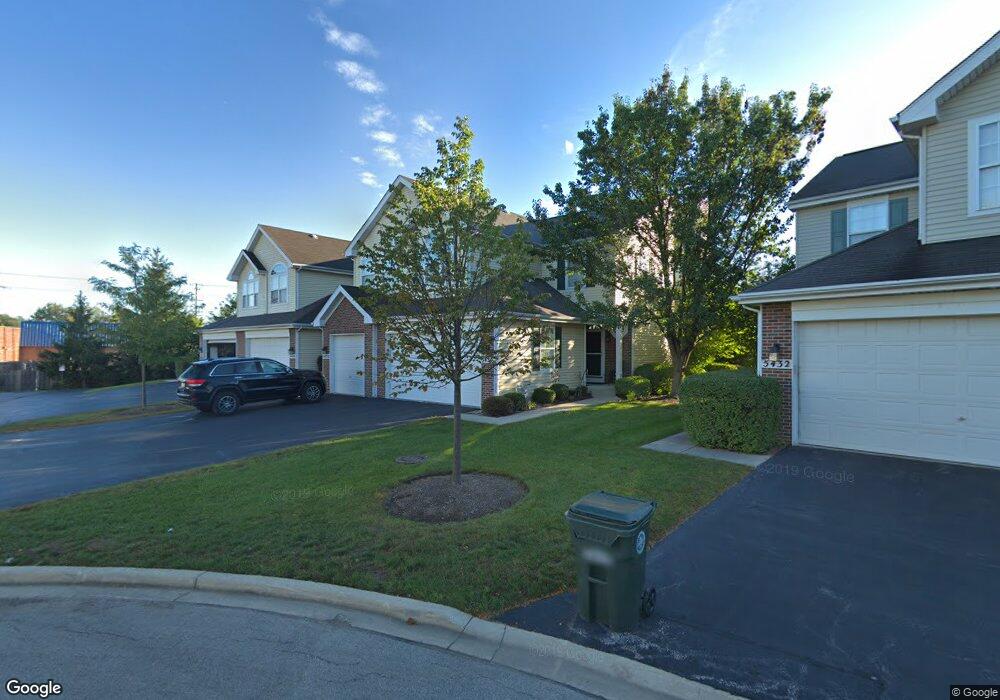
5428 Teaberry Ct Unit 17 Rolling Meadows, IL 60008
Busse Woods NeighborhoodEstimated Value: $294,615 - $372,000
2
Beds
3
Baths
10,300
Sq Ft
$33/Sq Ft
Est. Value
About This Home
This home is located at 5428 Teaberry Ct Unit 17, Rolling Meadows, IL 60008 and is currently estimated at $339,154, approximately $32 per square foot. 5428 Teaberry Ct Unit 17 is a home located in Cook County with nearby schools including Willow Bend Elementary School, Carl Sandburg Junior High School, and Rolling Meadows High School.
Ownership History
Date
Name
Owned For
Owner Type
Purchase Details
Closed on
Aug 10, 2004
Sold by
Calderon John E and Calderon Suzanne F
Bought by
Tee Shyue Yeng and Leung Wen Ying
Current Estimated Value
Home Financials for this Owner
Home Financials are based on the most recent Mortgage that was taken out on this home.
Original Mortgage
$184,000
Outstanding Balance
$85,480
Interest Rate
5.37%
Mortgage Type
Purchase Money Mortgage
Estimated Equity
$253,674
Purchase Details
Closed on
Jul 17, 2001
Sold by
Acosta Ricardo V
Bought by
Calderon John E and Calderon Suzanne F
Home Financials for this Owner
Home Financials are based on the most recent Mortgage that was taken out on this home.
Original Mortgage
$144,900
Interest Rate
7.22%
Purchase Details
Closed on
Feb 26, 1997
Sold by
Kimball Hill Inc
Bought by
Acosta Ricardo V
Home Financials for this Owner
Home Financials are based on the most recent Mortgage that was taken out on this home.
Original Mortgage
$138,950
Interest Rate
7.82%
Mortgage Type
FHA
Create a Home Valuation Report for This Property
The Home Valuation Report is an in-depth analysis detailing your home's value as well as a comparison with similar homes in the area
Home Values in the Area
Average Home Value in this Area
Purchase History
| Date | Buyer | Sale Price | Title Company |
|---|---|---|---|
| Tee Shyue Yeng | $230,000 | Multiple | |
| Calderon John E | $205,000 | -- | |
| Acosta Ricardo V | $145,000 | -- |
Source: Public Records
Mortgage History
| Date | Status | Borrower | Loan Amount |
|---|---|---|---|
| Open | Tee Shyue Yeng | $184,000 | |
| Previous Owner | Calderon John E | $144,900 | |
| Previous Owner | Acosta Ricardo V | $138,950 |
Source: Public Records
Tax History
| Year | Tax Paid | Tax Assessment Tax Assessment Total Assessment is a certain percentage of the fair market value that is determined by local assessors to be the total taxable value of land and additions on the property. | Land | Improvement |
|---|---|---|---|---|
| 2025 | $7,381 | $31,257 | $3,436 | $27,821 |
| 2024 | $7,381 | $24,168 | $2,894 | $21,274 |
| 2023 | $7,061 | $24,168 | $2,894 | $21,274 |
| 2022 | $7,061 | $24,168 | $2,894 | $21,274 |
| 2021 | $5,203 | $15,794 | $1,899 | $13,895 |
| 2020 | $5,080 | $15,794 | $1,899 | $13,895 |
| 2019 | $1,732 | $9,414 | $1,899 | $7,515 |
| 2018 | $4,656 | $17,876 | $1,627 | $16,249 |
| 2017 | $4,580 | $17,876 | $1,627 | $16,249 |
| 2016 | $4,524 | $17,876 | $1,627 | $16,249 |
| 2015 | $4,791 | $17,918 | $1,446 | $16,472 |
| 2014 | $4,694 | $17,918 | $1,446 | $16,472 |
| 2013 | $4,563 | $17,918 | $1,446 | $16,472 |
Source: Public Records
Map
Nearby Homes
- 5400 Astor Ln Unit 116
- 5450 Astor Ln Unit 104
- 5450 Astor Ln Unit 415
- 1363 S Old Wilke Rd Unit 27
- 1322 S New Wilke Rd Unit 1C
- 1227 S Old Wilke Rd Unit 306
- 2504 Algonquin Rd Unit 14
- 5201 Carriageway Dr Unit C317
- 2508 Algonquin Rd Unit 16
- 5000 Carriageway Dr Unit 305
- 5000 Carriageway Dr Unit 211
- 1418 S Princeton Ave
- 1302 S Princeton Ave
- 5001 Carriage Way Dr Unit 116
- 1126 S New Wilke Rd Unit 307
- 1117 S Old Wilke Rd Unit 206
- 1107 S Old Wilke Rd Unit 103
- 1107 S Old Wilke Rd Unit 208
- 1615 S Harvard Ave
- 2830 Northampton Dr Unit A1
- 5428 Teaberry Ct Unit 1703
- 5426 Teaberry Ct Unit 1702
- 5430 Teaberry Ct
- 5424 Teaberry Ct Unit 1701
- 5432 Teaberry Ct
- 5434 Teaberry Ct Unit 1802
- 5436 Teaberry Ct Unit 1803
- 5438 Teaberry Ct
- 5418 Teaberry Ct Unit 1604
- 5420 Teaberry Ct Unit 1605
- 5422 Teaberry Ct Unit 1606
- 5416 Teaberry Ct Unit 1603
- 5414 Teaberry Ct Unit 1602
- 5446 Elizabeth Place Unit 1901
- 5413 Mayflower Ct Unit 2203
- 5412 Teaberry Ct Unit 1601
- 5405 Mayflower Ct Unit 2205
- 5417 Mayflower Ct
- 5401 Mayflower Ct Unit 2206
- 5450 Elizabeth Place Unit 1902
Your Personal Tour Guide
Ask me questions while you tour the home.