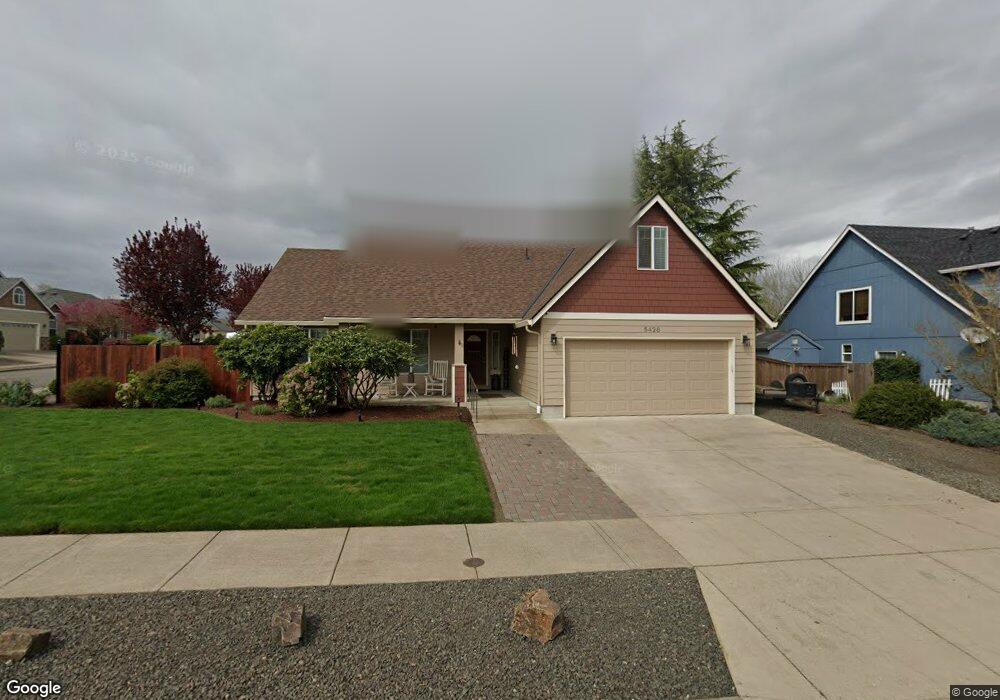
5428 Umpqua Ln NE Albany, OR 97321
Estimated Value: $536,572 - $567,000
3
Beds
2
Baths
1,660
Sq Ft
$332/Sq Ft
Est. Value
About This Home
This home is located at 5428 Umpqua Ln NE, Albany, OR 97321 and is currently estimated at $551,786, approximately $332 per square foot. 5428 Umpqua Ln NE is a home located in Linn County with nearby schools including Clover Ridge Elementary School, Timber Ridge School, and South Albany High School.
Ownership History
Date
Name
Owned For
Owner Type
Purchase Details
Closed on
May 23, 2007
Sold by
Chapman Jeremy D and Chapman Alyssa J
Bought by
Thomas Bobby D and Thomas Teresa A
Current Estimated Value
Home Financials for this Owner
Home Financials are based on the most recent Mortgage that was taken out on this home.
Original Mortgage
$204,000
Outstanding Balance
$123,547
Interest Rate
6.18%
Mortgage Type
Purchase Money Mortgage
Estimated Equity
$428,239
Purchase Details
Closed on
May 11, 2005
Sold by
Conser Homes Inc
Bought by
Chapman Jeremy D and Chapman Alyssa J
Home Financials for this Owner
Home Financials are based on the most recent Mortgage that was taken out on this home.
Original Mortgage
$153,590
Interest Rate
6%
Mortgage Type
Purchase Money Mortgage
Create a Home Valuation Report for This Property
The Home Valuation Report is an in-depth analysis detailing your home's value as well as a comparison with similar homes in the area
Home Values in the Area
Average Home Value in this Area
Purchase History
| Date | Buyer | Sale Price | Title Company |
|---|---|---|---|
| Thomas Bobby D | $255,000 | Lawyers Title Insurance Corp | |
| Chapman Jeremy D | $191,988 | Lawyers Title Ins |
Source: Public Records
Mortgage History
| Date | Status | Borrower | Loan Amount |
|---|---|---|---|
| Open | Thomas Bobby D | $204,000 | |
| Previous Owner | Chapman Jeremy D | $153,590 | |
| Closed | Chapman Jeremy D | $38,390 |
Source: Public Records
Tax History Compared to Growth
Tax History
| Year | Tax Paid | Tax Assessment Tax Assessment Total Assessment is a certain percentage of the fair market value that is determined by local assessors to be the total taxable value of land and additions on the property. | Land | Improvement |
|---|---|---|---|---|
| 2025 | $4,784 | $306,740 | -- | -- |
| 2024 | $4,647 | $297,810 | -- | -- |
| 2023 | $4,514 | $289,140 | $0 | $0 |
| 2022 | $4,459 | $280,720 | $0 | $0 |
| 2021 | $4,160 | $272,550 | $0 | $0 |
| 2020 | $4,014 | $258,000 | $0 | $0 |
| 2019 | $3,662 | $233,720 | $0 | $0 |
| 2018 | $3,571 | $226,920 | $0 | $0 |
| 2017 | $3,353 | $220,320 | $0 | $0 |
| 2016 | $3,083 | $213,910 | $0 | $0 |
| 2015 | $3,037 | $207,680 | $0 | $0 |
| 2014 | $3,489 | $201,640 | $0 | $0 |
Source: Public Records
Map
Nearby Homes
- 3215 54th Ave NE
- 3208 54th Ave NE
- 3082 Yellowstone Place NE
- 5088 NE North Park Ct
- 3011 Trask Ln NE
- 4879 NE Granite Ave
- 2785 Alexander Ln NE
- 3051 NE Mosey Ave
- 6309 Elena St NE
- 6068 NE Tuscan Loop
- 6413 Cross St
- 2938 Kimila Dr NE
- 33724 Viewcrest Dr NE
- 2412 NE Summit Dr
- 2253 NE Summit Dr
- 2283 Barker Ct NE
- 39036 Scravel Hill Rd NE
- 2753 Dover Ave NW
- 38598 Scravel Hill Rd NE
- 3550 Scott Ave NE
- 5434 Umpqua Ln NE
- 3149 54th Ave NE
- 0 54th Ave Unit 1 14002293
- 3160 54th Ave NE
- 5468 Umpqua Ln NE
- Lot 1202 54th Ave NE
- Lot 1200 54th Ave NE
- 0 54th Ave NE Unit 2
- 5431 Umpqua Ln NE
- 3125 54th Ave NE
- 3140 54th Ave NE
- 5455 Nestucca Ave NE
- 5455 Nestucca Ave NE
- 3120 54th Ave NE
- 3180 54th Ave NE
- 5494 Umpqua Ln NE
- 5332 Umpqua Ln NE
- 5471 Umpqua Ln NE
- 3085 54th Ave NE
- 5465 Nestucca Ave NE