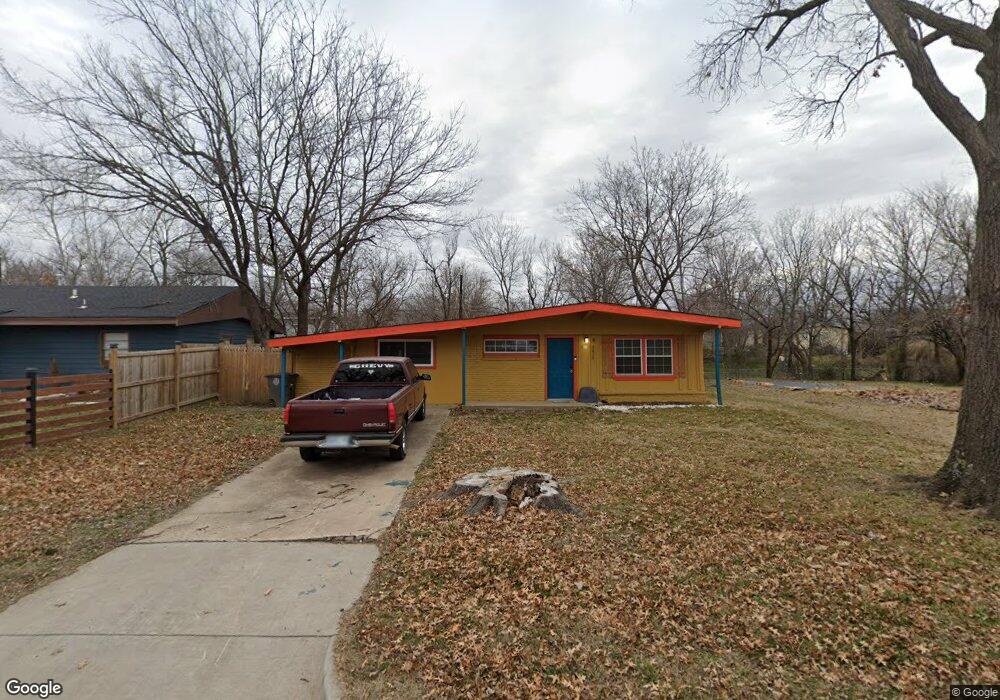
5429 N Frankfort East Ave Tulsa, OK 74126
Chamberlain NeighborhoodEstimated Value: $97,617
3
Beds
1
Bath
1,014
Sq Ft
$96/Sq Ft
Est. Value
About This Home
This home is located at 5429 N Frankfort East Ave, Tulsa, OK 74126 and is currently priced at $97,617, approximately $96 per square foot. 5429 N Frankfort East Ave is a home located in Tulsa County with nearby schools including Monroe Demonstration Academy, McLain High School of Science and Technology, and Tulsa Legacy Charter School.
Ownership History
Date
Name
Owned For
Owner Type
Purchase Details
Closed on
Jul 8, 2024
Sold by
Grace Apostolic Temple Inc
Bought by
Return To Hope Inc
Current Estimated Value
Purchase Details
Closed on
Mar 1, 2021
Sold by
Jackson Tamara
Bought by
Block Builderz
Purchase Details
Closed on
May 7, 2012
Sold by
Flatirons Financial Inc
Bought by
Grace Apostolic Temple Inc
Purchase Details
Closed on
Jul 15, 2011
Sold by
Lau Robin
Bought by
Flatirons Financial Inc
Purchase Details
Closed on
Aug 14, 2007
Sold by
Timax Properties Llc
Bought by
Lau Robin
Home Financials for this Owner
Home Financials are based on the most recent Mortgage that was taken out on this home.
Original Mortgage
$44,100
Interest Rate
14.5%
Mortgage Type
Purchase Money Mortgage
Purchase Details
Closed on
Aug 5, 1999
Sold by
Rogers Randal W and Rogers Shawna A
Bought by
Birge William F
Create a Home Valuation Report for This Property
The Home Valuation Report is an in-depth analysis detailing your home's value as well as a comparison with similar homes in the area
Home Values in the Area
Average Home Value in this Area
Purchase History
| Date | Buyer | Sale Price | Title Company |
|---|---|---|---|
| Return To Hope Inc | -- | None Listed On Document | |
| Block Builderz | $3,000 | -- | |
| Grace Apostolic Temple Inc | -- | None Available | |
| Flatirons Financial Inc | -- | None Available | |
| Lau Robin | $24,000 | True Title | |
| Birge William F | -- | -- |
Source: Public Records
Mortgage History
| Date | Status | Borrower | Loan Amount |
|---|---|---|---|
| Previous Owner | Lau Robin | $44,100 |
Source: Public Records
Tax History Compared to Growth
Tax History
| Year | Tax Paid | Tax Assessment Tax Assessment Total Assessment is a certain percentage of the fair market value that is determined by local assessors to be the total taxable value of land and additions on the property. | Land | Improvement |
|---|---|---|---|---|
| 2024 | $496 | $4,104 | $813 | $3,291 |
| 2023 | $496 | $3,908 | $968 | $2,940 |
| 2022 | $320 | $2,399 | $683 | $1,716 |
| 2021 | $317 | $2,399 | $683 | $1,716 |
| 2020 | $313 | $2,399 | $683 | $1,716 |
| 2019 | $329 | $2,399 | $683 | $1,716 |
| 2018 | $329 | $2,399 | $683 | $1,716 |
| 2017 | $329 | $3,399 | $968 | $2,431 |
| 2016 | $322 | $3,399 | $968 | $2,431 |
| 2015 | $323 | $3,399 | $968 | $2,431 |
| 2014 | $320 | $3,399 | $968 | $2,431 |
Source: Public Records
Map
Nearby Homes
- 5439 N Frankfort Ave
- 536 E 55th St N
- 414 E 54th St N
- 5462 N Hartford Ave
- 713 E 54th Place N
- 5464 N Hartford Place
- 614 E 52nd St N
- 5512 N Hartford Place
- 517 E 57th St N
- 729 E 54th St N
- 223 E 52nd St N
- 542 E 59th St N
- 809 E 52nd St N
- 557 E 59th St N
- 3 W 50th Place N
- 120 W 50th Place N
- 1027 E 56th St N
- 1045 E 51st Place N
- 4680 N Boston Ave
- 1110 E 49th St N
- 5429 N Frankfort Ave
- 5425 N Frankfort Ave
- 5435 N Frankfort Ave
- 5430 N Frankfort Place
- 5419 N Frankfort Ave
- 5434 N Frankfort Place
- 5424 N Frankfort Place
- 5438 N Frankfort Place
- 5420 N Frankfort Place
- 5428 N Frankfort Ave
- 5434 N Frankfort Ave
- 5424 N Frankfort Ave
- 5444 N Frankfort Place
- 5413 N Frankfort Ave
- 5443 N Frankfort Ave
- 5446 N Frankfort Ave
- 5414 N Frankfort Place
- 5506 N Frankfort Place
- 5409 N Frankfort Ave
- 5414 N Frankfort East Ave