Estimated Value: $258,250 - $279,000
3
Beds
2
Baths
1,426
Sq Ft
$190/Sq Ft
Est. Value
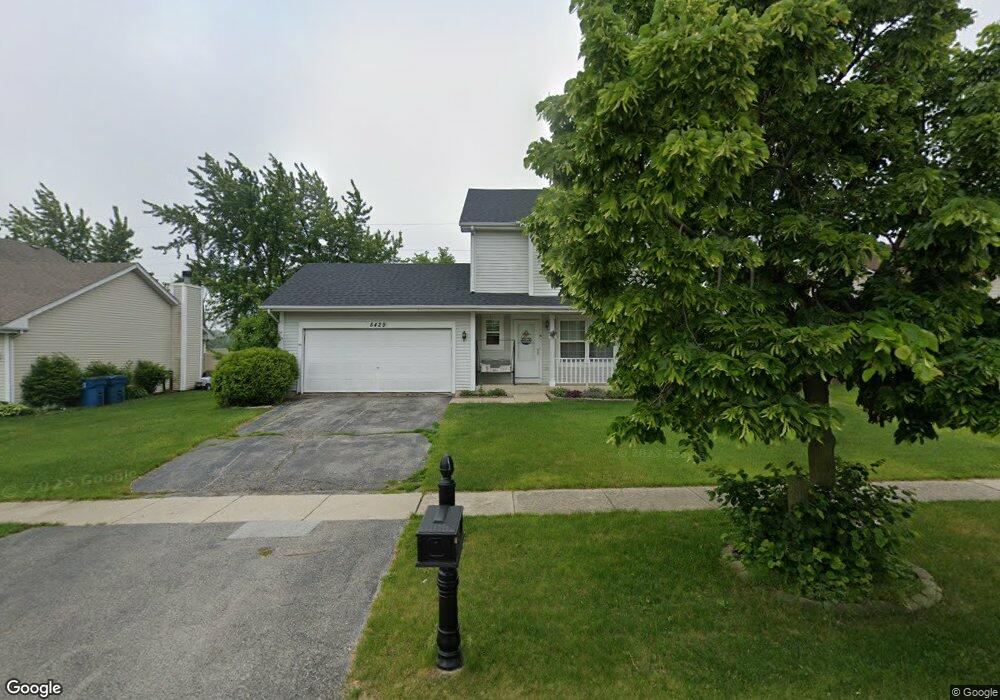
About This Home
This home is located at 5429 W Orchard Trail, Monee, IL 60449 and is currently estimated at $271,063, approximately $190 per square foot. 5429 W Orchard Trail is a home located in Will County with nearby schools including Monee Elementary School, Crete-Monee Middle School, and Crete-Monee High School.
Ownership History
Date
Name
Owned For
Owner Type
Purchase Details
Closed on
Jul 25, 2019
Sold by
Mags Team Llc
Bought by
Clear Sherrod O
Current Estimated Value
Home Financials for this Owner
Home Financials are based on the most recent Mortgage that was taken out on this home.
Original Mortgage
$142,373
Outstanding Balance
$125,490
Interest Rate
4.12%
Mortgage Type
FHA
Estimated Equity
$145,573
Purchase Details
Closed on
Apr 9, 2018
Sold by
Tovar Jose B and Tovar Connie
Bought by
Mags Team Llc
Purchase Details
Closed on
Aug 8, 2017
Sold by
Lionberg William C and Lionberg Mary Jane
Bought by
Tovar Jose B and Tovar Connie
Purchase Details
Closed on
Feb 17, 1998
Sold by
Peotone Bank & Trust
Bought by
Lionberg William A and Lionberg Mary Jane
Home Financials for this Owner
Home Financials are based on the most recent Mortgage that was taken out on this home.
Original Mortgage
$126,700
Interest Rate
6.95%
Mortgage Type
FHA
Create a Home Valuation Report for This Property
The Home Valuation Report is an in-depth analysis detailing your home's value as well as a comparison with similar homes in the area
Home Values in the Area
Average Home Value in this Area
Purchase History
| Date | Buyer | Sale Price | Title Company |
|---|---|---|---|
| Clear Sherrod O | $145,000 | Plymouth Title Guaranty Corp | |
| Mags Team Llc | -- | Attorney | |
| Tovar Jose B | $100,000 | Homestar Title Company | |
| Lionberg William A | $129,000 | Chicago Title Insurance Co |
Source: Public Records
Mortgage History
| Date | Status | Borrower | Loan Amount |
|---|---|---|---|
| Open | Clear Sherrod O | $142,373 | |
| Previous Owner | Lionberg William A | $126,700 |
Source: Public Records
Tax History Compared to Growth
Tax History
| Year | Tax Paid | Tax Assessment Tax Assessment Total Assessment is a certain percentage of the fair market value that is determined by local assessors to be the total taxable value of land and additions on the property. | Land | Improvement |
|---|---|---|---|---|
| 2024 | $6,724 | $72,481 | $16,241 | $56,240 |
| 2023 | $6,724 | $62,484 | $14,001 | $48,483 |
| 2022 | $5,783 | $54,965 | $12,316 | $42,649 |
| 2021 | $5,474 | $50,094 | $11,312 | $38,782 |
| 2020 | $5,444 | $48,470 | $10,945 | $37,525 |
| 2019 | $6,060 | $45,965 | $10,379 | $35,586 |
| 2018 | $5,919 | $44,234 | $10,153 | $34,081 |
| 2017 | $4,259 | $42,091 | $9,965 | $32,126 |
| 2016 | $3,452 | $39,109 | $9,616 | $29,493 |
| 2015 | $3,313 | $35,733 | $8,764 | $26,969 |
| 2014 | $3,313 | $35,240 | $8,643 | $26,597 |
| 2013 | $3,313 | $36,900 | $9,050 | $27,850 |
Source: Public Records
Map
Nearby Homes
- 5406 W Mulberry Ln
- 5320 W Orchard Trail
- 5332 W Mulberry Ln
- 5221 W Mulberry Ln
- Lot 4 S Governors Hwy
- 5421 W Main St
- 5420 W Main St
- 4942 W Ribbon Ct
- 25927 Derby Dr
- 26205 S Ruby St
- 26253 S Ruby St Unit 1
- 5110 Fairground Ct
- 5155 W Main St
- 26616 S Egyptian Trail
- 26103 S Ruby St Unit 1
- 25836 S Linden Ave
- 25830 S Chestnut Rd
- 5203 W Court St
- 5531 W Hilltop Rd
- 4999 W Hawk Ln
- 5423 W Orchard Trail
- 5435 W Orchard Trail
- 5441 W Orchard Trail
- 5417 W Orchard Trail
- 26252 S Locust Place
- 5436 W Orchard Trail
- 5411 W Orchard Trail
- 5447 W Orchard Trail
- 26240 S Locust Place
- 26235 S Peach Tree Ln
- 26253 S Locust Place
- 5407 W Orchard Trail
- 5455 W Orchard Trail
- 26229 S Peach Tree Ln
- 26234 S Locust Place
- 26233 S Locust Place
- 26254 S Peach Tree Ln
- 5501 W Orchard Trail
- 5401 W Orchard Trail
- 26242 S Peach Tree Ln