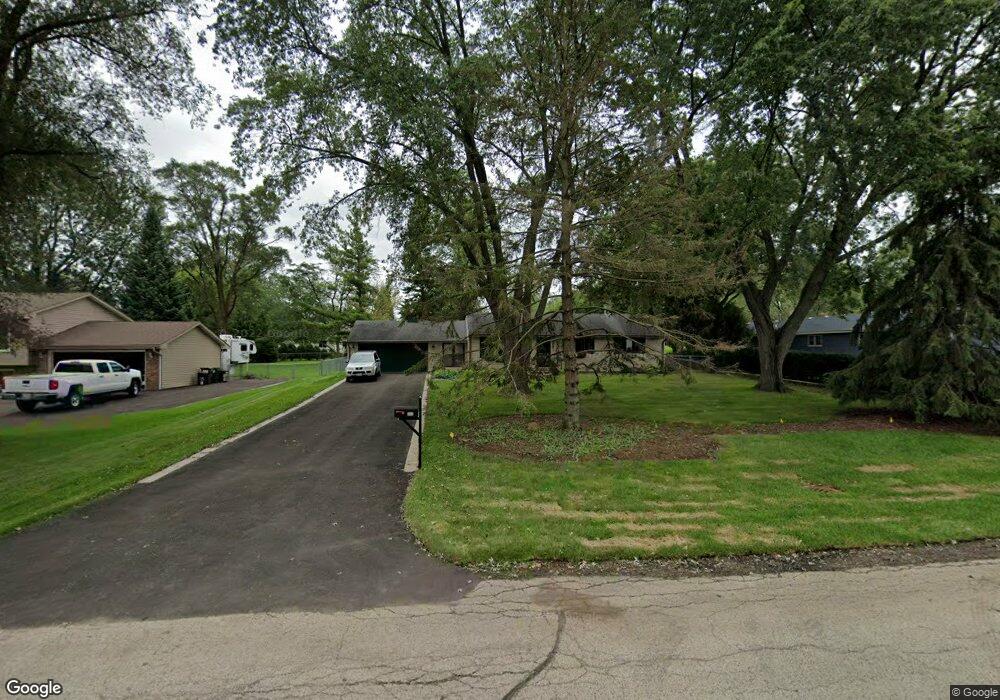
543 71st St Darien, IL 60561
Estimated Value: $375,669 - $511,000
3
Beds
2
Baths
1,128
Sq Ft
$390/Sq Ft
Est. Value
About This Home
This home is located at 543 71st St, Darien, IL 60561 and is currently estimated at $440,417, approximately $390 per square foot. 543 71st St is a home located in DuPage County with nearby schools including Mark Delay School, Lace Elementary School, and Eisenhower Jr High School.
Ownership History
Date
Name
Owned For
Owner Type
Purchase Details
Closed on
Sep 22, 2009
Sold by
Kulagowski Robert and Kulagowski Christine
Bought by
Sims Quentin T and Sims Renee J
Current Estimated Value
Home Financials for this Owner
Home Financials are based on the most recent Mortgage that was taken out on this home.
Original Mortgage
$224,000
Outstanding Balance
$147,903
Interest Rate
5.38%
Mortgage Type
New Conventional
Estimated Equity
$292,514
Purchase Details
Closed on
May 21, 2001
Sold by
Selvaggio Frances
Bought by
Kulagowski Robert and Kulagowski Christine
Home Financials for this Owner
Home Financials are based on the most recent Mortgage that was taken out on this home.
Original Mortgage
$201,400
Interest Rate
6.37%
Purchase Details
Closed on
Sep 6, 1996
Sold by
Ureel Kathleen A and Evans Mary J
Bought by
Selvaggio Frances and Selvaggio Nello
Create a Home Valuation Report for This Property
The Home Valuation Report is an in-depth analysis detailing your home's value as well as a comparison with similar homes in the area
Home Values in the Area
Average Home Value in this Area
Purchase History
| Date | Buyer | Sale Price | Title Company |
|---|---|---|---|
| Sims Quentin T | $280,000 | Ticor Title | |
| Kulagowski Robert | $212,000 | Chicago Title Insurance Co | |
| Selvaggio Frances | $162,000 | -- |
Source: Public Records
Mortgage History
| Date | Status | Borrower | Loan Amount |
|---|---|---|---|
| Open | Sims Quentin T | $224,000 | |
| Previous Owner | Kulagowski Robert | $201,400 |
Source: Public Records
Tax History Compared to Growth
Tax History
| Year | Tax Paid | Tax Assessment Tax Assessment Total Assessment is a certain percentage of the fair market value that is determined by local assessors to be the total taxable value of land and additions on the property. | Land | Improvement |
|---|---|---|---|---|
| 2024 | $5,431 | $100,295 | $64,202 | $36,093 |
| 2023 | $5,171 | $92,200 | $59,020 | $33,180 |
| 2022 | $5,374 | $86,280 | $56,150 | $30,130 |
| 2021 | $5,169 | $85,300 | $55,510 | $29,790 |
| 2020 | $5,097 | $83,610 | $54,410 | $29,200 |
| 2019 | $4,922 | $80,230 | $52,210 | $28,020 |
| 2018 | $4,210 | $70,000 | $51,950 | $18,050 |
| 2017 | $4,163 | $67,360 | $49,990 | $17,370 |
| 2016 | $4,048 | $64,290 | $47,710 | $16,580 |
| 2015 | $3,981 | $60,490 | $44,890 | $15,600 |
| 2014 | $4,012 | $60,140 | $43,650 | $16,490 |
| 2013 | $5,059 | $76,260 | $43,450 | $32,810 |
Source: Public Records
Map
Nearby Homes
- 7216 Leonard Dr
- 7510 Farmingdale Dr Unit 208
- 7525 Nantucket Dr Unit 210
- 7515 Nantucket Dr Unit 404
- 320 Sheridan Dr Unit 2C
- 6542 Bentley Ave
- 6136 Bentley Ave
- 6540 Bentley Ave
- 6538 Bentley Ave
- 824 High Ridge Ct
- 209 67th St
- 7715 Sussex Creek Dr Unit 1D
- 7310 Capitol Dr
- 1121 Lodgepole Ct
- 301 Lake Hinsdale Dr Unit 106
- 301 Lake Hinsdale Dr Unit 404
- 501 Lake Hinsdale Dr Unit 504
- 501 Lake Hinsdale Dr Unit 207
- 501 Lake Hinsdale Dr Unit 307
- 1145 Lacebark Ct