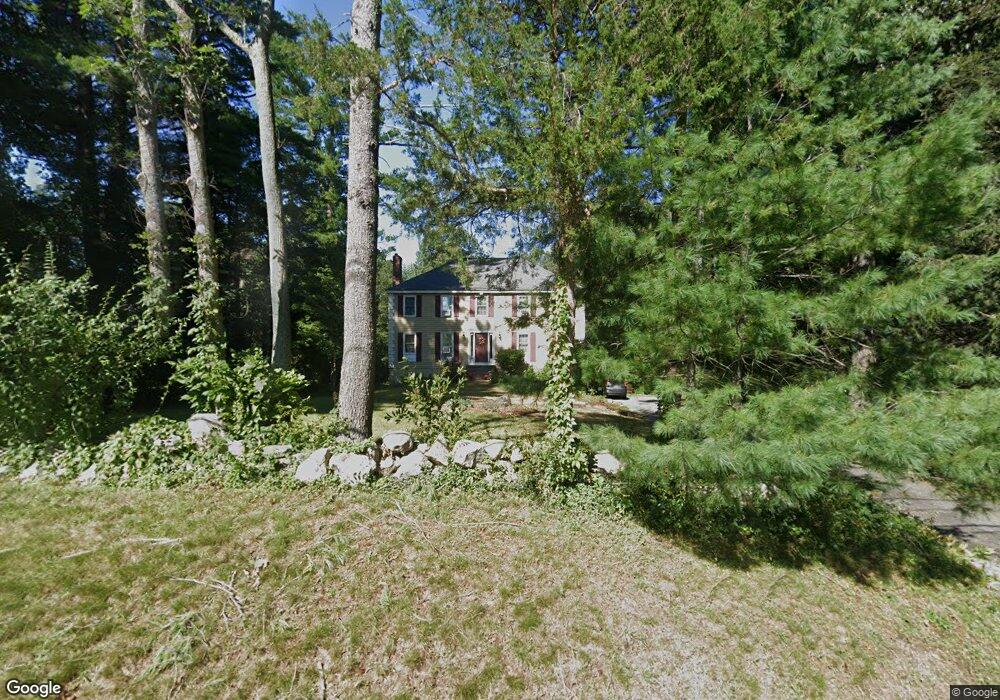
543 Boston St North Andover, MA 01845
Estimated Value: $932,010 - $1,109,000
4
Beds
3
Baths
2,503
Sq Ft
$408/Sq Ft
Est. Value
About This Home
This home is located at 543 Boston St, North Andover, MA 01845 and is currently estimated at $1,020,003, approximately $407 per square foot. 543 Boston St is a home located in Essex County with nearby schools including Franklin Elementary School, North Andover Middle School, and North Andover High School.
Ownership History
Date
Name
Owned For
Owner Type
Purchase Details
Closed on
Jul 10, 2015
Sold by
Mccarthy Joseph C and Beyer-Mccarthy Lee
Bought by
Mccarthy Ft and Beyer Charles E
Current Estimated Value
Purchase Details
Closed on
Aug 25, 1989
Sold by
Johnson Terrell R
Bought by
Loiselle Robert
Create a Home Valuation Report for This Property
The Home Valuation Report is an in-depth analysis detailing your home's value as well as a comparison with similar homes in the area
Home Values in the Area
Average Home Value in this Area
Purchase History
| Date | Buyer | Sale Price | Title Company |
|---|---|---|---|
| Mccarthy Ft | -- | -- | |
| Loiselle Robert | $275,000 | -- |
Source: Public Records
Mortgage History
| Date | Status | Borrower | Loan Amount |
|---|---|---|---|
| Previous Owner | Loiselle Robert | $250,000 | |
| Previous Owner | Loiselle Robert | $344,300 | |
| Previous Owner | Loiselle Robert | $150,000 | |
| Previous Owner | Loiselle Robert | $105,000 |
Source: Public Records
Tax History Compared to Growth
Tax History
| Year | Tax Paid | Tax Assessment Tax Assessment Total Assessment is a certain percentage of the fair market value that is determined by local assessors to be the total taxable value of land and additions on the property. | Land | Improvement |
|---|---|---|---|---|
| 2025 | $9,671 | $858,900 | $419,300 | $439,600 |
| 2024 | $9,191 | $828,800 | $397,500 | $431,300 |
| 2023 | $8,749 | $714,800 | $335,700 | $379,100 |
| 2022 | $8,509 | $628,900 | $305,200 | $323,700 |
| 2021 | $8,151 | $575,200 | $276,900 | $298,300 |
| 2020 | $7,903 | $575,200 | $276,900 | $298,300 |
| 2019 | $7,713 | $575,200 | $276,900 | $298,300 |
| 2018 | $8,358 | $575,200 | $276,900 | $298,300 |
| 2017 | $8,121 | $568,700 | $216,900 | $351,800 |
| 2016 | $7,673 | $537,700 | $215,600 | $322,100 |
| 2015 | -- | $540,100 | $212,100 | $328,000 |
Source: Public Records
Map
Nearby Homes
- 8 Athena Cir
- 2 Tamys Ln
- 7 Sullivan St
- 133B Salem
- 104 Salem St
- 17 Linda Rd
- 3 Harvest Dr Unit 106
- 2 Harvest Dr Unit 301
- 3 Harvest Dr Unit 303
- 3 Harvest Dr Unit 107
- 331 S Main St
- 10 Woodchuck Ln
- 18 Boston Rd
- 11 Gould Rd
- 50 Hidden Rd
- 12 Farnum St
- 40 Ballardvale Rd
- 53 Salem St
- 40 Colonial Dr Unit 8
- 20 Colonial Dr Unit 3
- 531 Boston St
- 555 Boston St
- 1 Jenkins Rd
- 8 Windkist Farm Rd
- 515 Boston St
- 534 Boston St
- 3 Rachel Rd
- 15 Windkist Farm Rd
- Boston-Int Compass Point Unit 1
- 503 Boston St
- 6 Rachel Rd
- 520 Boston St
- 14 Windkist Farm Rd
- 1 Rachel Rd
- 4 Rachel Rd
- 506 Boston St
- 30 Windkist Farm Rd
- 6 Jenkins Rd
- 2 Jenkins Rd
- 11 Paddock Ln