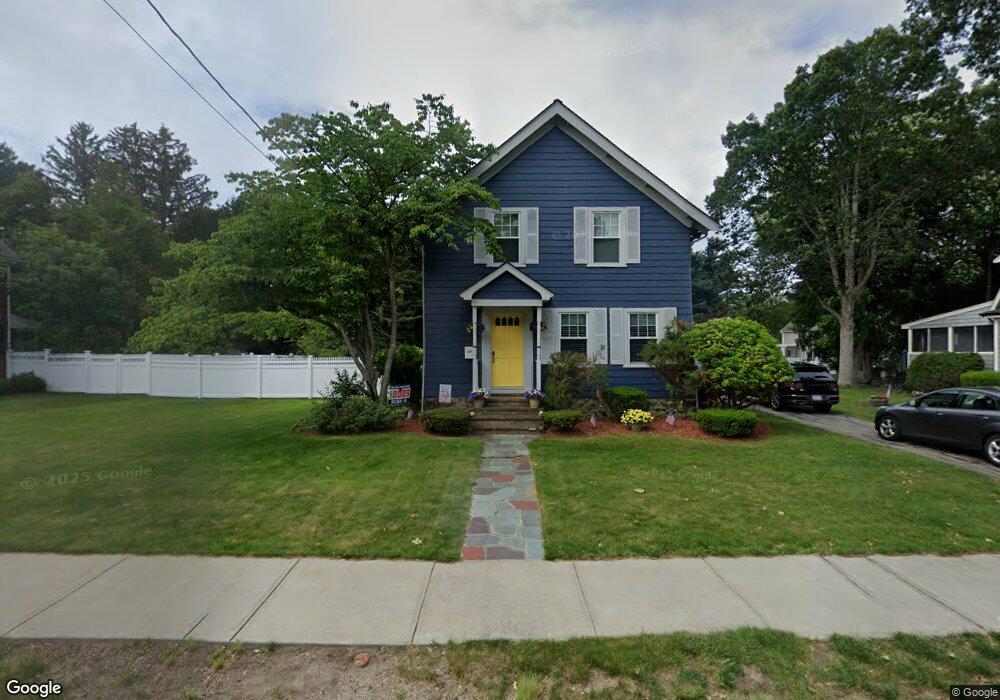
543 Common St Walpole, MA 02081
Estimated Value: $592,000 - $691,000
3
Beds
2
Baths
1,300
Sq Ft
$479/Sq Ft
Est. Value
About This Home
This home is located at 543 Common St, Walpole, MA 02081 and is currently estimated at $622,842, approximately $479 per square foot. 543 Common St is a home located in Norfolk County with nearby schools including Boyden School, Eleanor N. Johnson Middle School, and Walpole High School.
Ownership History
Date
Name
Owned For
Owner Type
Purchase Details
Closed on
Jan 9, 2018
Sold by
Bonarrigo Jason T and Bonarrigo Kerri A
Bought by
Bonarrigo Jason T
Current Estimated Value
Purchase Details
Closed on
Dec 15, 2003
Sold by
Adams Marilyn A and Boardman Tammy A
Bought by
Bonarrigo Jason T and Bonarrigo Kerri Ann
Home Financials for this Owner
Home Financials are based on the most recent Mortgage that was taken out on this home.
Original Mortgage
$342,000
Interest Rate
5.9%
Mortgage Type
Purchase Money Mortgage
Purchase Details
Closed on
Oct 14, 1994
Sold by
Lawson Mary E
Bought by
Custom Colonial Homes
Create a Home Valuation Report for This Property
The Home Valuation Report is an in-depth analysis detailing your home's value as well as a comparison with similar homes in the area
Home Values in the Area
Average Home Value in this Area
Purchase History
| Date | Buyer | Sale Price | Title Company |
|---|---|---|---|
| Bonarrigo Jason T | -- | -- | |
| Bonarrigo Jason T | $360,000 | -- | |
| Custom Colonial Homes | $180,000 | -- |
Source: Public Records
Mortgage History
| Date | Status | Borrower | Loan Amount |
|---|---|---|---|
| Previous Owner | Bonarrigo Jason T | $342,000 |
Source: Public Records
Tax History
| Year | Tax Paid | Tax Assessment Tax Assessment Total Assessment is a certain percentage of the fair market value that is determined by local assessors to be the total taxable value of land and additions on the property. | Land | Improvement |
|---|---|---|---|---|
| 2025 | $6,796 | $529,700 | $293,900 | $235,800 |
| 2024 | $6,609 | $499,900 | $282,600 | $217,300 |
| 2023 | $6,453 | $464,600 | $245,800 | $218,800 |
| 2022 | $6,080 | $420,500 | $227,600 | $192,900 |
| 2021 | $5,798 | $390,700 | $214,700 | $176,000 |
| 2020 | $5,849 | $390,200 | $202,500 | $187,700 |
| 2019 | $5,579 | $369,500 | $194,800 | $174,700 |
| 2018 | $5,177 | $339,000 | $187,900 | $151,100 |
| 2017 | $4,998 | $326,000 | $180,700 | $145,300 |
| 2016 | $4,724 | $303,600 | $173,700 | $129,900 |
| 2015 | $4,581 | $291,800 | $165,500 | $126,300 |
| 2014 | $4,411 | $279,900 | $165,500 | $114,400 |
Source: Public Records
Map
Nearby Homes
- 6 Eleanor Rd
- 37 Alice Ave
- 587 Common St
- 635 Old Post Rd Unit 303
- 635 Old Post Rd Unit 302
- 635 Old Post Rd Unit 2-203
- 0 U S Route 1
- 145 South St Unit 5
- 1549 Washington St Unit A
- 3 Stone Hill Terrace
- 50 Riverside Place
- 224 School St Unit 9
- 1391 Main St Unit 308
- 1391 Main St Unit 306
- 1391 Main St Unit 304
- 222 School St Unit 9
- 1110 Main St
- 9 Pearl St
- 1 Palace Ct
- 1 Merganser Way
Your Personal Tour Guide
Ask me questions while you tour the home.