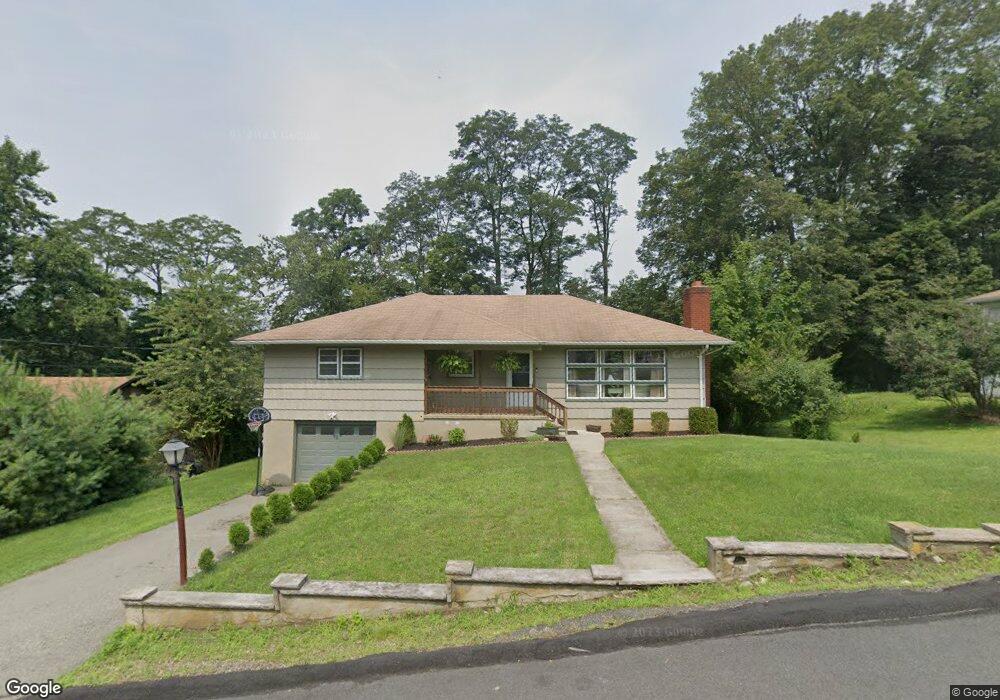
543 Dell Rd Landing, NJ 07850
Estimated Value: $421,000 - $478,000
Studio
--
Bath
1,412
Sq Ft
$317/Sq Ft
Est. Value
About This Home
This home is located at 543 Dell Rd, Landing, NJ 07850 and is currently estimated at $447,421, approximately $316 per square foot. 543 Dell Rd is a home located in Morris County with nearby schools including Edith M. Decker Elementary School, Mt. Arlington Public School, and Elite Preparatory Academy.
Ownership History
Date
Name
Owned For
Owner Type
Purchase Details
Closed on
Jul 7, 2021
Sold by
Smolen Tracy
Bought by
Rodriguez Juan Carlos and Brogni Keter Da
Current Estimated Value
Home Financials for this Owner
Home Financials are based on the most recent Mortgage that was taken out on this home.
Original Mortgage
$306,348
Interest Rate
2.8%
Mortgage Type
FHA
Purchase Details
Closed on
Sep 12, 2016
Sold by
Smolen Tracy
Bought by
Smolen Tracy
Create a Home Valuation Report for This Property
The Home Valuation Report is an in-depth analysis detailing your home's value as well as a comparison with similar homes in the area
Home Values in the Area
Average Home Value in this Area
Purchase History
| Date | Buyer | Sale Price | Title Company |
|---|---|---|---|
| Rodriguez Juan Carlos | $312,000 | All Ahead Title Agency Llc | |
| Smolen Tracy | -- | None Available |
Source: Public Records
Mortgage History
| Date | Status | Borrower | Loan Amount |
|---|---|---|---|
| Previous Owner | Rodriguez Juan Carlos | $306,348 |
Source: Public Records
Tax History
| Year | Tax Paid | Tax Assessment Tax Assessment Total Assessment is a certain percentage of the fair market value that is determined by local assessors to be the total taxable value of land and additions on the property. | Land | Improvement |
|---|---|---|---|---|
| 2025 | $6,147 | $301,900 | $137,100 | $164,800 |
| 2024 | $5,902 | $301,900 | $137,100 | $164,800 |
| 2023 | $5,902 | $301,900 | $137,100 | $164,800 |
| 2022 | $6,621 | $242,000 | $142,100 | $99,900 |
| 2021 | $6,621 | $242,000 | $142,100 | $99,900 |
| 2020 | $6,510 | $242,000 | $142,100 | $99,900 |
| 2019 | $6,377 | $242,000 | $142,100 | $99,900 |
| 2018 | $6,362 | $242,000 | $142,100 | $99,900 |
| 2017 | $6,290 | $242,000 | $142,100 | $99,900 |
| 2016 | $6,277 | $242,000 | $142,100 | $99,900 |
| 2015 | $5,919 | $242,000 | $142,100 | $99,900 |
| 2014 | $5,848 | $242,000 | $142,100 | $99,900 |
Source: Public Records
Map
Nearby Homes
- 592 Dell Rd
- 512 Colver Rd
- 625 E Vail Rd
- 627 E Vail Rd
- 517 Vail Rd
- 38 Silver Springs Dr
- 510 Davsel Rd
- 625 Succasunna Rd
- 603 Bensel Dr
- 21 Laurie Rd
- 305 Kingsland Rd
- 24 Bertrand Island Rd
- 12 Ford Rd
- 245 Howard Blvd
- 181 Orben Dr
- 38 Spruce Terrace Unit 4832
- 48 Hickory Way Unit 4001
- 41 Catamaran Ct
- 16 Spruce Terrace Unit 4932
- 30 Hickory Way
Your Personal Tour Guide
Ask me questions while you tour the home.