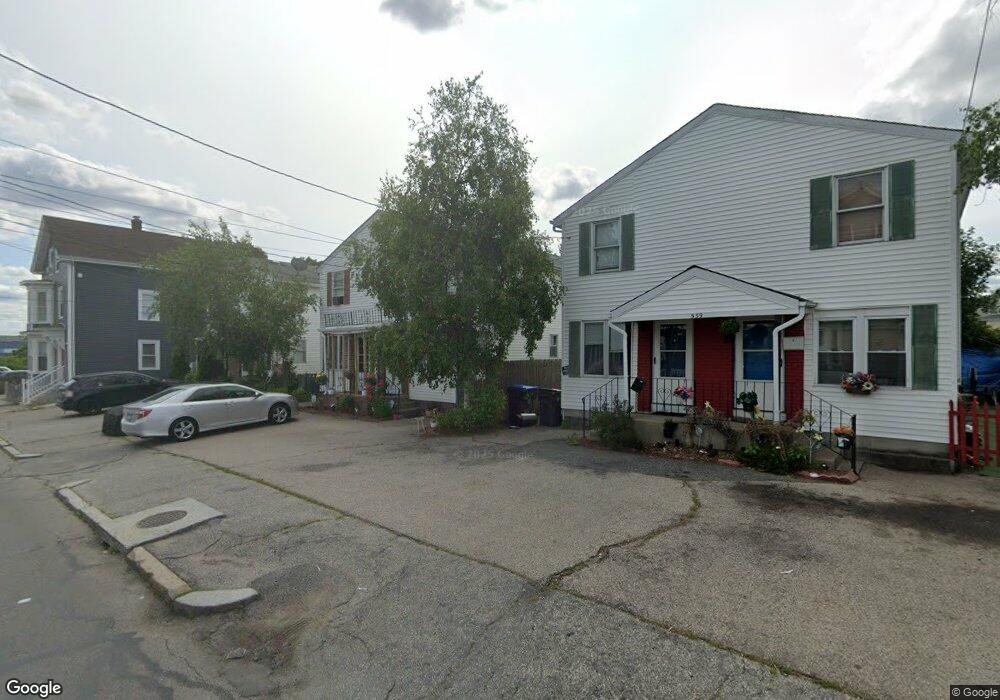
543 Dexter St Providence, RI 02907
West End Neighborhood
4
Beds
4
Baths
2,080
Sq Ft
3,180
Sq Ft Lot
About This Home
This home is located at 543 Dexter St, Providence, RI 02907. 543 Dexter St is a home located in Providence County with nearby schools including Highlander Charter School, Achievement First Iluminar Mayoral Academy, and Achievement First Iluminar Mayoral Academy Middle School.
Create a Home Valuation Report for This Property
The Home Valuation Report is an in-depth analysis detailing your home's value as well as a comparison with similar homes in the area
Home Values in the Area
Average Home Value in this Area
Tax History
| Year | Tax Paid | Tax Assessment Tax Assessment Total Assessment is a certain percentage of the fair market value that is determined by local assessors to be the total taxable value of land and additions on the property. | Land | Improvement |
|---|---|---|---|---|
| 2025 | $6,502 | $464,400 | $106,900 | $357,500 |
| 2024 | $6,599 | $359,600 | $71,300 | $288,300 |
| 2023 | $6,599 | $359,600 | $71,300 | $288,300 |
| 2022 | $6,401 | $359,600 | $71,300 | $288,300 |
| 2021 | $5,344 | $217,600 | $33,200 | $184,400 |
| 2020 | $5,344 | $217,600 | $33,200 | $184,400 |
| 2019 | $5,344 | $217,600 | $33,200 | $184,400 |
| 2018 | $4,752 | $148,700 | $32,900 | $115,800 |
| 2017 | $4,752 | $148,700 | $32,900 | $115,800 |
| 2016 | $4,752 | $148,700 | $32,900 | $115,800 |
| 2015 | $4,386 | $132,500 | $32,900 | $99,600 |
| 2014 | $4,472 | $132,500 | $32,900 | $99,600 |
| 2013 | $4,472 | $132,500 | $32,900 | $99,600 |
Source: Public Records
Map
Nearby Homes
Your Personal Tour Guide
Ask me questions while you tour the home.