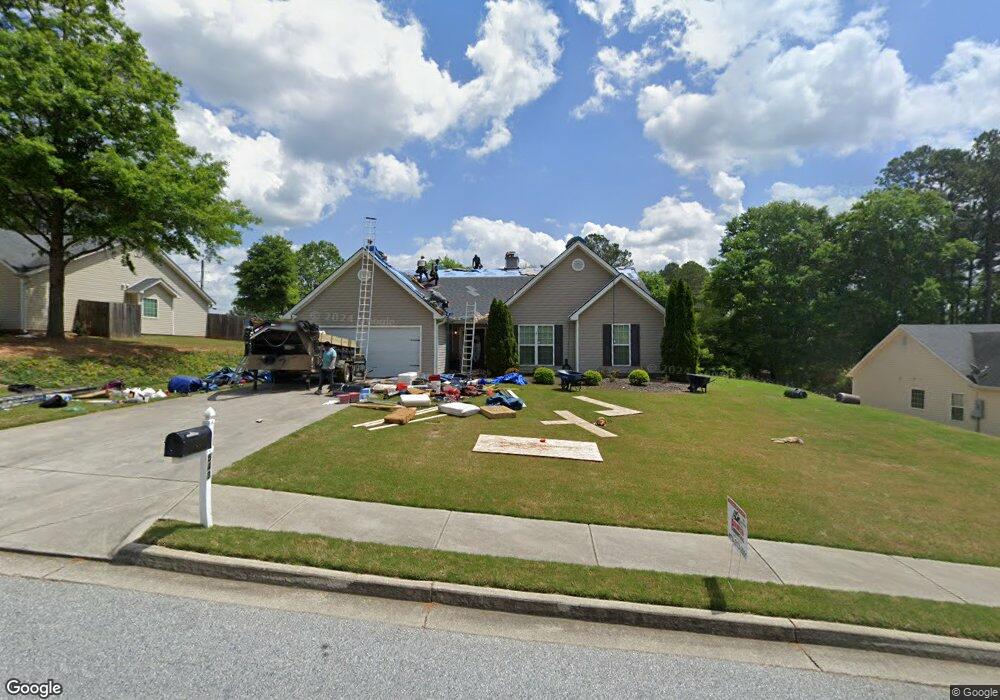
543 Embassy Walk Unit 12B Winder, GA 30680
Estimated Value: $358,000 - $425,000
4
Beds
2
Baths
2,252
Sq Ft
$170/Sq Ft
Est. Value
About This Home
This home is located at 543 Embassy Walk Unit 12B, Winder, GA 30680 and is currently estimated at $382,455, approximately $169 per square foot. 543 Embassy Walk Unit 12B is a home located in Barrow County with nearby schools including Holsenbeck Elementary School, Bear Creek Middle School, and Winder-Barrow High School.
Ownership History
Date
Name
Owned For
Owner Type
Purchase Details
Closed on
Apr 19, 2013
Sold by
Southfork Homes Llc
Bought by
Usbeck Carol J and Usbeck Carol J Revocable Tru
Current Estimated Value
Home Financials for this Owner
Home Financials are based on the most recent Mortgage that was taken out on this home.
Original Mortgage
$97,900
Outstanding Balance
$69,478
Interest Rate
3.59%
Mortgage Type
New Conventional
Estimated Equity
$312,977
Purchase Details
Closed on
Apr 18, 2013
Sold by
Embassy Development Llc
Bought by
Southfork Homes Llc
Home Financials for this Owner
Home Financials are based on the most recent Mortgage that was taken out on this home.
Original Mortgage
$97,900
Outstanding Balance
$69,478
Interest Rate
3.59%
Mortgage Type
New Conventional
Estimated Equity
$312,977
Purchase Details
Closed on
Dec 17, 2008
Sold by
Embassy Walk Of Winder Llc
Bought by
Embassy Development Llc
Purchase Details
Closed on
Feb 24, 2006
Sold by
Ydi Inc
Bought by
Embassy Walk Of Winder Llc
Create a Home Valuation Report for This Property
The Home Valuation Report is an in-depth analysis detailing your home's value as well as a comparison with similar homes in the area
Home Values in the Area
Average Home Value in this Area
Purchase History
| Date | Buyer | Sale Price | Title Company |
|---|---|---|---|
| Usbeck Carol J | $127,900 | -- | |
| Southfork Homes Llc | $45,000 | -- | |
| Embassy Development Llc | -- | -- | |
| Embassy Walk Of Winder Llc | -- | -- |
Source: Public Records
Mortgage History
| Date | Status | Borrower | Loan Amount |
|---|---|---|---|
| Open | Usbeck Carol J | $97,900 |
Source: Public Records
Tax History Compared to Growth
Tax History
| Year | Tax Paid | Tax Assessment Tax Assessment Total Assessment is a certain percentage of the fair market value that is determined by local assessors to be the total taxable value of land and additions on the property. | Land | Improvement |
|---|---|---|---|---|
| 2024 | $3,847 | $139,775 | $26,000 | $113,775 |
| 2023 | $2,949 | $124,987 | $26,000 | $98,987 |
| 2022 | $3,453 | $105,444 | $22,400 | $83,044 |
| 2021 | $2,805 | $82,515 | $16,000 | $66,515 |
| 2020 | $2,463 | $75,006 | $14,000 | $61,006 |
| 2019 | $2,314 | $69,496 | $14,000 | $55,496 |
| 2018 | $2,123 | $63,986 | $14,000 | $49,986 |
| 2017 | $1,742 | $58,399 | $14,000 | $44,399 |
| 2016 | $1,702 | $54,619 | $14,000 | $40,619 |
| 2015 | $1,715 | $55,030 | $14,000 | $41,030 |
| 2014 | $1,520 | $49,850 | $8,820 | $41,030 |
| 2013 | -- | $2,000 | $2,000 | $0 |
Source: Public Records
Map
Nearby Homes
- 53 Twin Lakes Rd
- 64 Dunagan Ct
- 15 Twin Lakes Rd
- 240 Westlyn Way
- 38 Saint Germaine Place Unit 2
- 295 E Wright St
- 526 Stoneridge Dr
- 17 Saint Germaine Place
- 55 Huckleberry Ln
- 24 Lays Ln
- 23 Stanton Way
- 211 Brooks Ln
- 17 Mockingbird Ln Unit 11
- 88 Mockingbird Ln Unit 37
- 303 Mockingbird Ln Unit 22
- 100 Mockingbird Ln Unit 36
- 45 Waverly Ln
- 206 Atlas Ln
- 543 Embassy Walk
- 545 Embassy Walk
- 541 Embassy Walk
- 541 Embassy Walk Unit 11B
- 547 Embassy Walk
- 544 Embassy Walk
- 539 Embassy Walk
- 542 Embassy Walk
- 546 Embassy Walk
- 538 Embassy Walk
- 549 Embassy Walk Unit 15B
- 549 Embassy Walk
- 76 Picklesimon Rd
- 548 Embassy Walk
- 548 Embassy Walk Unit 11
- 537 Embassy Walk
- 534 Embassy Walk
- 551 Embassy Walk
- 551 Embassy Walk Unit 16B
- 290 Ambassador Cir