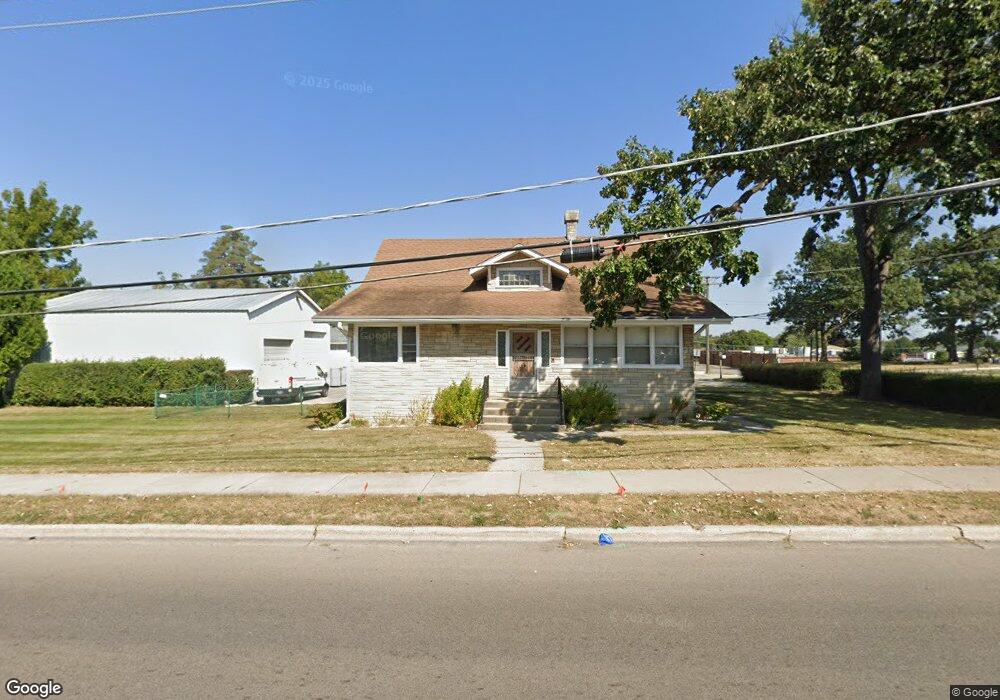
543 Lake St Antioch, IL 60002
Estimated Value: $291,000 - $383,000
3
Beds
1
Bath
1,312
Sq Ft
$251/Sq Ft
Est. Value
About This Home
This home is located at 543 Lake St, Antioch, IL 60002 and is currently estimated at $329,414, approximately $251 per square foot. 543 Lake St is a home located in Lake County with nearby schools including Antioch Community High School.
Ownership History
Date
Name
Owned For
Owner Type
Purchase Details
Closed on
Jan 11, 2019
Sold by
Volling Gordon K and Gordon A Volling Revocable Tru
Bought by
Volling Dennis K
Current Estimated Value
Home Financials for this Owner
Home Financials are based on the most recent Mortgage that was taken out on this home.
Original Mortgage
$190,000
Outstanding Balance
$169,178
Interest Rate
5.25%
Mortgage Type
New Conventional
Estimated Equity
$160,236
Purchase Details
Closed on
Jul 11, 1997
Sold by
Volling Gordon H A and Volling Laurene K
Bought by
Volling Gordon A and Gordon A Volling Revocable Tru
Create a Home Valuation Report for This Property
The Home Valuation Report is an in-depth analysis detailing your home's value as well as a comparison with similar homes in the area
Home Values in the Area
Average Home Value in this Area
Purchase History
| Date | Buyer | Sale Price | Title Company |
|---|---|---|---|
| Volling Dennis K | $237,500 | Gmt Title Agency | |
| Volling Gordon A | -- | -- |
Source: Public Records
Mortgage History
| Date | Status | Borrower | Loan Amount |
|---|---|---|---|
| Open | Volling Dennis K | $190,000 |
Source: Public Records
Tax History Compared to Growth
Tax History
| Year | Tax Paid | Tax Assessment Tax Assessment Total Assessment is a certain percentage of the fair market value that is determined by local assessors to be the total taxable value of land and additions on the property. | Land | Improvement |
|---|---|---|---|---|
| 2024 | $7,728 | $87,338 | $27,952 | $59,386 |
| 2023 | $7,667 | $78,204 | $25,029 | $53,175 |
| 2022 | $7,667 | $74,260 | $26,983 | $47,277 |
| 2021 | $7,099 | $69,292 | $25,178 | $44,114 |
| 2020 | $6,950 | $67,379 | $24,483 | $42,896 |
| 2019 | $7,043 | $64,434 | $23,413 | $41,021 |
| 2018 | $6,095 | $57,602 | $10,928 | $46,674 |
| 2017 | $6,032 | $54,828 | $10,402 | $44,426 |
| 2016 | $5,874 | $52,913 | $10,039 | $42,874 |
| 2015 | $5,731 | $51,567 | $9,784 | $41,783 |
| 2014 | $5,604 | $54,272 | $12,256 | $42,016 |
| 2012 | $5,186 | $54,272 | $12,256 | $42,016 |
Source: Public Records
Map
Nearby Homes
- 1009 Osmond Ave
- 431 Filweber Ct
- 0 Highview Dr Unit MRD11912210
- 775 Highview Ct
- 0 Anita Ave Unit MRD12354735
- 770 Anita Ave
- 316 Buena Terrace
- 1207 Main St
- 782 Cameron Dr
- 672 Garys Dr
- 152 E Depot St
- 468 Joren Trail
- 168 Tree Line
- 68 Burnette Dr
- 73 W Old Mill Trail
- 56 Burnette Dr
- 1412 Redwing Dr
- 25118 W Catherine Ave
- 52 Burnette Dr
- 49 Burnette Dr
- 914 Hillside Ave
- 914 Hillside Ave Unit 1
- 914 Hillside Ave Unit 5
- 914 Hillside Ave Unit 3
- 914 Hillside Ave Unit 4
- 914 Hillside Ave Unit 2
- 906 Hillside Ave
- 900 Hillside Ave
- 532 Lake St Unit C
- 532 Lake St
- 950 Hillside Ave
- 961 Hillside Ave Unit A
- 888 Hillside Ave
- 514 Lake St
- 884 Hillside Ave
- 976 Hillside Ave
- 510 Lake St
- 499 Lake St
- 496 Orchard St
- 515 Naber Ave