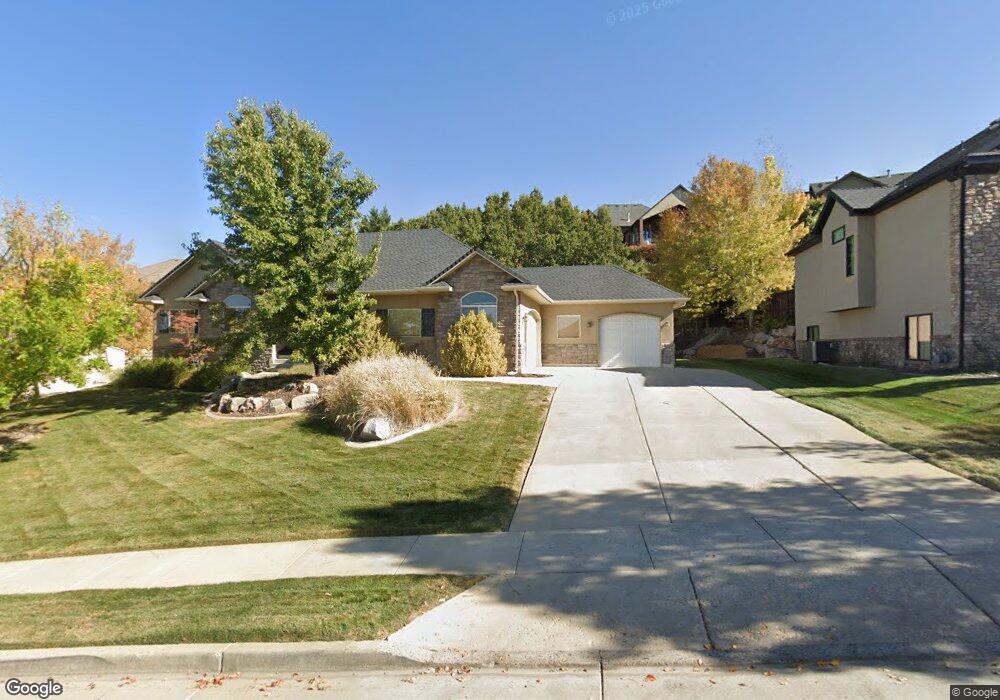
543 Lofty Ln North Salt Lake, UT 84054
Estimated Value: $698,000 - $911,000
3
Beds
3
Baths
3,650
Sq Ft
$221/Sq Ft
Est. Value
About This Home
This home is located at 543 Lofty Ln, North Salt Lake, UT 84054 and is currently estimated at $806,188, approximately $220 per square foot. 543 Lofty Ln is a home located in Davis County with nearby schools including Orchard School, South Davis Junior High School, and Woods Cross High School.
Ownership History
Date
Name
Owned For
Owner Type
Purchase Details
Closed on
Feb 6, 2004
Sold by
Gold Victor V and Gold Rebekah
Bought by
Gold and Gold Rebekah R
Current Estimated Value
Home Financials for this Owner
Home Financials are based on the most recent Mortgage that was taken out on this home.
Original Mortgage
$60,000
Interest Rate
5.82%
Mortgage Type
Credit Line Revolving
Purchase Details
Closed on
Dec 30, 2003
Sold by
Kraatz Carson A and Kraatz Corrie D
Bought by
Gold and Gold Rebekah
Home Financials for this Owner
Home Financials are based on the most recent Mortgage that was taken out on this home.
Original Mortgage
$60,000
Interest Rate
5.82%
Mortgage Type
Credit Line Revolving
Purchase Details
Closed on
Sep 6, 2000
Sold by
Cordova Ltd
Bought by
Kraatz Carson A and Kraatz Corrie D
Home Financials for this Owner
Home Financials are based on the most recent Mortgage that was taken out on this home.
Original Mortgage
$273,650
Interest Rate
8.62%
Mortgage Type
Construction
Create a Home Valuation Report for This Property
The Home Valuation Report is an in-depth analysis detailing your home's value as well as a comparison with similar homes in the area
Purchase History
| Date | Buyer | Sale Price | Title Company |
|---|---|---|---|
| Gold | -- | First American Title Co | |
| Gold | -- | First American Title | |
| Kraatz Carson A | -- | Associated Title Company |
Source: Public Records
Mortgage History
| Date | Status | Borrower | Loan Amount |
|---|---|---|---|
| Closed | Gold | $60,000 | |
| Open | Gold | $252,000 | |
| Previous Owner | Kraatz Carson A | $273,650 | |
| Closed | Gold | $47,250 |
Source: Public Records
Tax History
| Year | Tax Paid | Tax Assessment Tax Assessment Total Assessment is a certain percentage of the fair market value that is determined by local assessors to be the total taxable value of land and additions on the property. | Land | Improvement |
|---|---|---|---|---|
| 2025 | $5,104 | $504,900 | $238,383 | $266,517 |
| 2024 | $4,762 | $479,050 | $248,745 | $230,305 |
| 2023 | $4,465 | $812,000 | $325,247 | $486,753 |
| 2022 | $4,457 | $444,950 | $180,180 | $264,770 |
| 2021 | $4,060 | $615,000 | $267,448 | $347,552 |
| 2020 | $3,764 | $564,000 | $232,826 | $331,174 |
| 2019 | $3,914 | $572,000 | $224,909 | $347,091 |
| 2018 | $3,660 | $529,000 | $202,229 | $326,771 |
| 2016 | $2,898 | $222,750 | $105,784 | $116,966 |
| 2015 | $3,184 | $235,125 | $105,784 | $129,341 |
| 2014 | $2,867 | $215,859 | $105,784 | $110,075 |
| 2013 | -- | $208,486 | $95,860 | $112,626 |
Source: Public Records
Map
Nearby Homes
- 609 Parkway Dr
- 341 Edgemont Dr
- 684 Eagle Pass
- 755 Parkway Dr
- 843 Eaglepointe Dr
- 316 Bella Vida Dr
- 340 Bella Vida Dr
- 178 E Edgecrest Ln
- 460 S Sunset Ridge Dr
- 634 Mountain View Cir
- 93 E Edgecrest Ln
- 794 S Miller Ave
- 910 S Pace Place
- 371 E 100 S
- 977 Parkway Dr
- 871 S Winter Ln
- 672 S Skyview Cir Unit 113R
- 886 S Winter Ln
- 664 Wildflower Cir
- 951 S Winter Ln Unit 209
Your Personal Tour Guide
Ask me questions while you tour the home.