543 Main St Warren, RI 02885
Downtown Warren NeighborhoodEstimated Value: $419,956
About This Home
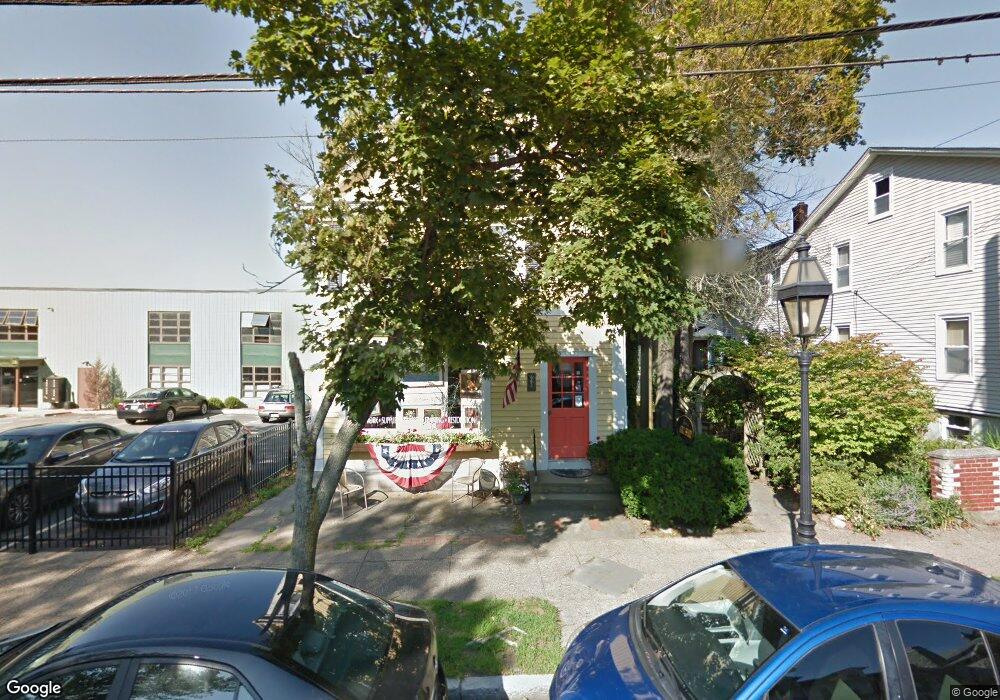
This home is located at 543 Main St, Warren, RI 02885 and is currently estimated at $419,956, approximately $154 per square foot. 543 Main St is a home located in Bristol County with nearby schools including Mt. Hope High School, Highlander Charter Middle and High School, and East Bay Career Academy.
Ownership History
We collect this data history from publicly available records. To have your information removed, we recommend requesting removal directly through your county’s website.
Purchase Details
Home Financials for this Owner
Home Financials are based on the most recent Mortgage that was taken out on this home.Home Values in the Area
Average Home Value in this Area
Purchase History
We collect this data history from publicly available records. To have your information removed, we recommend requesting removal directly through your county’s website.
| Date | Buyer | Sale Price | Title Company |
|---|---|---|---|
| $100,000 | -- |
Mortgage History
We collect this data history from publicly available records. To have your information removed, we recommend requesting removal directly through your county’s website.
| Date | Status | Borrower | Loan Amount |
|---|---|---|---|
| Open | $60,000 | ||
| Closed | $60,000 | ||
| Closed | $50,000 | ||
| Closed | $100,000 |
Tax History
We collect this data history from publicly available records. To have your information removed, we recommend requesting removal directly through your county’s website.
| Year | Tax Paid | Tax Assessment Tax Assessment Total Assessment is a certain percentage of the fair market value that is determined by local assessors to be the total taxable value of land and additions on the property. | Land | Improvement |
|---|---|---|---|---|
| 2025 | $6,519 | $437,800 | $125,500 | $312,300 |
| 2024 | $6,322 | $437,800 | $125,500 | $312,300 |
| 2023 | $5,980 | $437,800 | $125,500 | $312,300 |
| 2022 | $5,560 | $308,700 | $109,800 | $198,900 |
| 2021 | $5,470 | $308,700 | $109,800 | $198,900 |
| 2020 | $5,359 | $308,700 | $109,800 | $198,900 |
| 2019 | $5,339 | $279,400 | $107,500 | $171,900 |
| 2018 | $5,269 | $279,400 | $107,500 | $171,900 |
| 2017 | $5,256 | $279,400 | $107,500 | $171,900 |
| 2016 | $5,124 | $256,600 | $103,100 | $153,500 |
| 2015 | $5,124 | $256,600 | $103,100 | $153,500 |
| 2014 | $5,150 | $256,600 | $103,100 | $153,500 |
Map
- 533 Main St
- 533B Main St
- 533A Main St
- 546 Main St
- 546 Main St Unit 2
- 2 Washington St
- 542 Main St
- 14 Washington St
- 16 Manning St
- 18 Washington St
- 205 Withheld
- 0 Sea Gull Way Unit 71375884
- 0 Sea Gull Way Unit 71499220
- 577 Main St
- 17 Croade St
- 520 Main St
- 10 Broad St
- 10 Broad St Unit 1
- 14 Broad St
- 24 Lyndon St
Ask me questions while you tour the home.