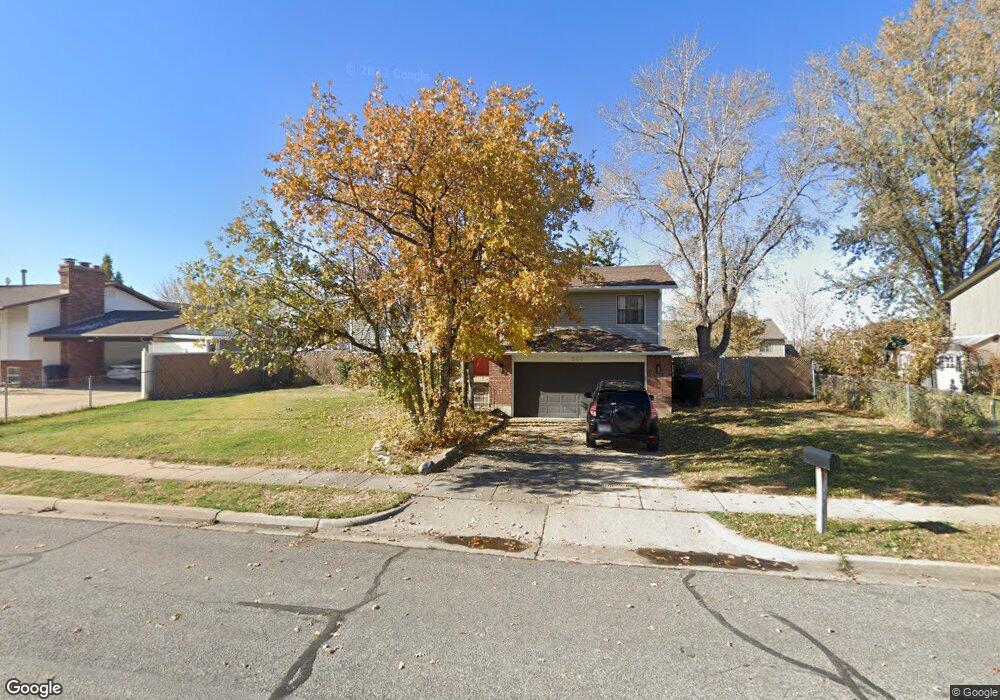
543 N 150 W Centerville, UT 84014
Estimated Value: $494,000 - $548,662
5
Beds
2
Baths
2,142
Sq Ft
$245/Sq Ft
Est. Value
About This Home
This home is located at 543 N 150 W, Centerville, UT 84014 and is currently estimated at $524,166, approximately $244 per square foot. 543 N 150 W is a home located in Davis County with nearby schools including Centerville Elementary, Centerville Jr High, and Viewmont High School.
Ownership History
Date
Name
Owned For
Owner Type
Purchase Details
Closed on
Apr 15, 2008
Sold by
Cash Brady T
Bought by
Cash Brady T and Cash Megan Phillips
Current Estimated Value
Home Financials for this Owner
Home Financials are based on the most recent Mortgage that was taken out on this home.
Original Mortgage
$180,500
Outstanding Balance
$113,949
Interest Rate
5.99%
Mortgage Type
Purchase Money Mortgage
Estimated Equity
$410,217
Purchase Details
Closed on
Feb 4, 2008
Sold by
Maughan Mary Sweeten
Bought by
Maughan Mary S and The Mary S Maughan Revocable Trust
Purchase Details
Closed on
Nov 10, 2001
Sold by
Sweeten Mary H and Maughan Mary Sweeten
Bought by
Maughan Mary Sweeten
Home Financials for this Owner
Home Financials are based on the most recent Mortgage that was taken out on this home.
Original Mortgage
$23,000
Interest Rate
6.62%
Create a Home Valuation Report for This Property
The Home Valuation Report is an in-depth analysis detailing your home's value as well as a comparison with similar homes in the area
Purchase History
| Date | Buyer | Sale Price | Title Company |
|---|---|---|---|
| Cash Brady T | -- | Accommodation | |
| Cash Brady T | -- | Bonneville Superior Title Co | |
| Maughan Mary S | -- | None Available | |
| Maughan Mary Sweeten | -- | Associated Title Company |
Source: Public Records
Mortgage History
| Date | Status | Borrower | Loan Amount |
|---|---|---|---|
| Open | Cash Brady T | $180,500 | |
| Previous Owner | Maughan Mary Sweeten | $23,000 |
Source: Public Records
Tax History
| Year | Tax Paid | Tax Assessment Tax Assessment Total Assessment is a certain percentage of the fair market value that is determined by local assessors to be the total taxable value of land and additions on the property. | Land | Improvement |
|---|---|---|---|---|
| 2025 | $2,777 | $265,650 | $166,602 | $99,048 |
| 2024 | $2,651 | $257,950 | $150,531 | $107,419 |
| 2023 | $2,531 | $445,000 | $245,888 | $199,112 |
| 2022 | $2,648 | $256,300 | $124,370 | $131,930 |
| 2021 | $2,387 | $360,000 | $190,942 | $169,058 |
| 2020 | $2,063 | $311,000 | $185,955 | $125,045 |
| 2019 | $2,092 | $308,000 | $184,590 | $123,410 |
| 2018 | $1,932 | $281,000 | $171,184 | $109,816 |
| 2016 | $1,529 | $123,585 | $55,591 | $67,994 |
| 2015 | $1,639 | $115,830 | $55,978 | $59,852 |
| 2014 | $1,386 | $103,873 | $55,978 | $47,895 |
| 2013 | -- | $109,227 | $48,624 | $60,603 |
Source: Public Records
Map
Nearby Homes
- 282 W 605 N Unit A
- 282 W 605 N Unit I
- 281 W 650 N Unit B
- 303 W 650 N Unit I
- 165 W Pheasantbrook Dr
- 775 Pheasantbrook Cir
- 781 Pheasantbrook Dr
- 66 Brookside Ln
- 493 W 620 N Unit 122
- 507 W 620 N
- 132 W 200 N
- 56 W 200 N
- 563 N 220 E
- 185 N 50 W
- 147 N 360 W Unit 21
- 271 Brookfield Ln
- 243 Balsam Dr
- 638 N 800 W
- 2 S 285 W
- 380 E 400 N
Your Personal Tour Guide
Ask me questions while you tour the home.