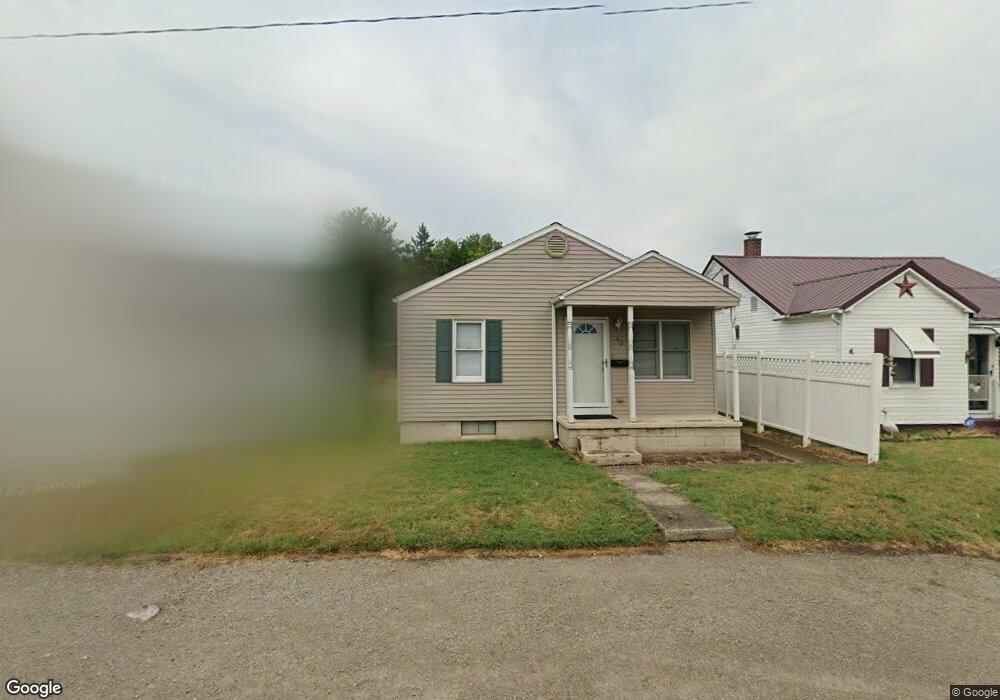
543 Orange St Chillicothe, OH 45601
Estimated Value: $153,000 - $185,000
--
Bed
1
Bath
864
Sq Ft
$197/Sq Ft
Est. Value
About This Home
This home is located at 543 Orange St, Chillicothe, OH 45601 and is currently estimated at $170,156, approximately $196 per square foot. 543 Orange St is a home located in Ross County with nearby schools including Chillicothe High School and Wesley Taylor Preparatory School.
Ownership History
Date
Name
Owned For
Owner Type
Purchase Details
Closed on
Jul 17, 2019
Sold by
Gray George E and Gray Kathy L
Bought by
Gray Michael J and The Gray Preservatioon Trust
Current Estimated Value
Purchase Details
Closed on
Jun 16, 2009
Sold by
Home Performing Fund I Llc
Bought by
Gray George E and Gray Kathy L
Home Financials for this Owner
Home Financials are based on the most recent Mortgage that was taken out on this home.
Original Mortgage
$71,000
Interest Rate
4.86%
Mortgage Type
Purchase Money Mortgage
Purchase Details
Closed on
Aug 25, 2008
Sold by
The Bank Of New York Trust Co Na
Bought by
Residential Funding Co Llc
Purchase Details
Closed on
Aug 14, 2008
Sold by
Residential Funding Company Llc
Bought by
Home Performing Fund I Llc
Purchase Details
Closed on
Jul 25, 2007
Sold by
Casto David
Bought by
The Bank Of New York
Create a Home Valuation Report for This Property
The Home Valuation Report is an in-depth analysis detailing your home's value as well as a comparison with similar homes in the area
Home Values in the Area
Average Home Value in this Area
Purchase History
| Date | Buyer | Sale Price | Title Company |
|---|---|---|---|
| Gray Michael J | $250 | None Available | |
| Gray George E | $54,000 | Attorney | |
| Residential Funding Co Llc | $15,000 | Ohio Real Title Agency Inc | |
| Home Performing Fund I Llc | -- | Attorney | |
| The Bank Of New York | $46,000 | Attorney |
Source: Public Records
Mortgage History
| Date | Status | Borrower | Loan Amount |
|---|---|---|---|
| Previous Owner | Gray George E | $71,000 |
Source: Public Records
Tax History Compared to Growth
Tax History
| Year | Tax Paid | Tax Assessment Tax Assessment Total Assessment is a certain percentage of the fair market value that is determined by local assessors to be the total taxable value of land and additions on the property. | Land | Improvement |
|---|---|---|---|---|
| 2024 | $1,410 | $34,560 | $6,200 | $28,360 |
| 2023 | $1,410 | $34,560 | $6,200 | $28,360 |
| 2022 | $1,435 | $34,560 | $6,200 | $28,360 |
| 2021 | $1,228 | $25,930 | $4,800 | $21,130 |
| 2020 | $1,228 | $25,930 | $4,800 | $21,130 |
| 2019 | $1,229 | $25,930 | $4,800 | $21,130 |
| 2018 | $1,180 | $23,570 | $4,800 | $18,770 |
| 2017 | $1,270 | $23,570 | $4,800 | $18,770 |
| 2016 | $1,258 | $23,570 | $4,800 | $18,770 |
| 2015 | $1,196 | $21,860 | $4,800 | $17,060 |
| 2014 | $1,174 | $21,860 | $4,800 | $17,060 |
| 2013 | $1,175 | $21,860 | $4,800 | $17,060 |
Source: Public Records
Map
Nearby Homes
- 2 Marlboro Dr
- 763 Buckeye St
- 847 Pine St
- 565 Allen Ave
- 662 Laurel St
- 625 Oneida Rd
- 387 Church St
- 322 Vine St
- 342 N High St
- 346 Yoctangee Pkwy
- 320 Fairway Ave
- 288 Church St
- 299 N High St
- 265 N High St
- 200 Winona Blvd
- 14996 Pleasant Valley Rd Unit Lot 60
- 14996 Pleasant Valley Rd Unit Lot 70
- 14996 Pleasant Valley Rd Unit Lot 53
- 228 Locust St
- 15 Windsor Dr