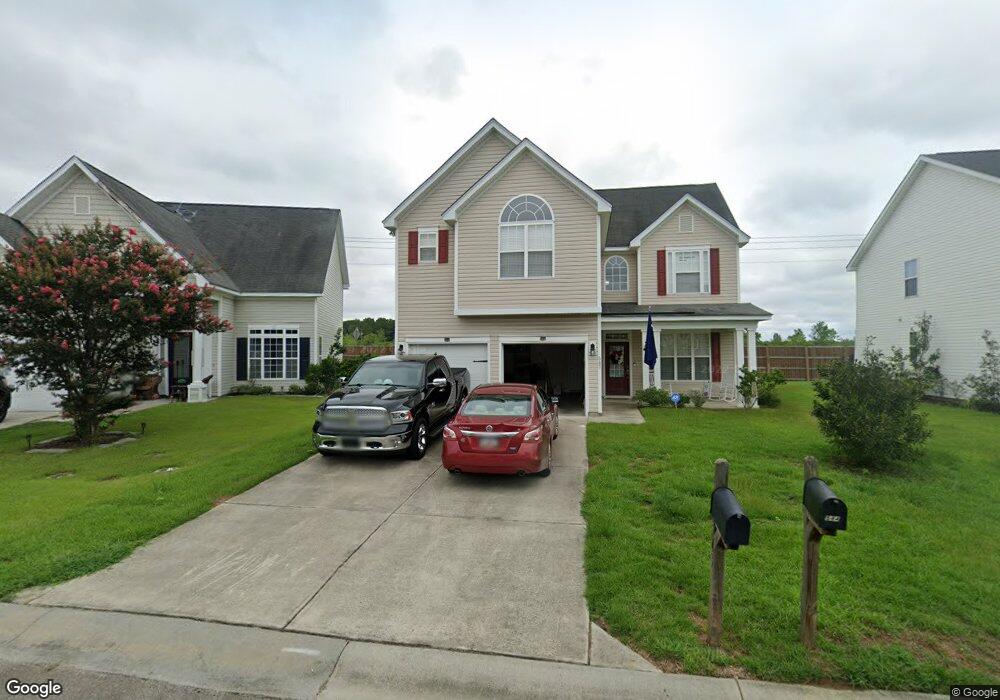
543 Pleasant Side Dr Moncks Corner, SC 29461
Estimated Value: $328,000 - $343,329
4
Beds
3
Baths
2,034
Sq Ft
$164/Sq Ft
Est. Value
About This Home
This home is located at 543 Pleasant Side Dr, Moncks Corner, SC 29461 and is currently estimated at $334,582, approximately $164 per square foot. 543 Pleasant Side Dr is a home located in Berkeley County with nearby schools including Whitesville Elementary School, Berkeley Middle School, and Berkeley High School.
Ownership History
Date
Name
Owned For
Owner Type
Purchase Details
Closed on
Aug 15, 2013
Sold by
Redus Sc Housing Llc
Bought by
Quinn Bradley S and Quinn Lori
Current Estimated Value
Home Financials for this Owner
Home Financials are based on the most recent Mortgage that was taken out on this home.
Original Mortgage
$145,500
Outstanding Balance
$108,591
Interest Rate
4.48%
Mortgage Type
Future Advance Clause Open End Mortgage
Estimated Equity
$225,991
Purchase Details
Closed on
Nov 28, 2012
Sold by
Legacy Homebuilders Inc
Bought by
Redus Sc Housing Llc
Purchase Details
Closed on
May 6, 2008
Sold by
Mml Llc
Bought by
Legacy Homebuilders Inc
Purchase Details
Closed on
Nov 26, 2007
Sold by
Lennar Carolinas Llc
Bought by
Mml Llc
Purchase Details
Closed on
Jun 8, 2006
Sold by
Mml Llc
Bought by
Lennar Carolinas Llc
Create a Home Valuation Report for This Property
The Home Valuation Report is an in-depth analysis detailing your home's value as well as a comparison with similar homes in the area
Home Values in the Area
Average Home Value in this Area
Purchase History
| Date | Buyer | Sale Price | Title Company |
|---|---|---|---|
| Quinn Bradley S | $150,000 | -- | |
| Redus Sc Housing Llc | $140,000 | -- | |
| Legacy Homebuilders Inc | $35,000 | -- | |
| Mml Llc | $1,060,000 | Attorney | |
| Lennar Carolinas Llc | $1,525,000 | None Available |
Source: Public Records
Mortgage History
| Date | Status | Borrower | Loan Amount |
|---|---|---|---|
| Open | Quinn Bradley S | $145,500 |
Source: Public Records
Tax History Compared to Growth
Tax History
| Year | Tax Paid | Tax Assessment Tax Assessment Total Assessment is a certain percentage of the fair market value that is determined by local assessors to be the total taxable value of land and additions on the property. | Land | Improvement |
|---|---|---|---|---|
| 2025 | $954 | $198,640 | $45,365 | $153,275 |
| 2024 | $954 | $7,946 | $1,815 | $6,131 |
| 2023 | $954 | $7,946 | $1,815 | $6,131 |
| 2022 | $952 | $6,909 | $1,252 | $5,657 |
| 2021 | $973 | $6,910 | $1,252 | $5,657 |
| 2020 | $985 | $6,909 | $1,252 | $5,657 |
| 2019 | $978 | $6,909 | $1,252 | $5,657 |
| 2018 | $916 | $6,008 | $1,280 | $4,728 |
| 2017 | $816 | $6,008 | $1,280 | $4,728 |
| 2016 | $835 | $6,010 | $1,280 | $4,730 |
| 2015 | $773 | $6,010 | $1,280 | $4,730 |
| 2014 | $761 | $6,010 | $1,280 | $4,730 |
| 2013 | -- | $6,010 | $1,280 | $4,730 |
Source: Public Records
Map
Nearby Homes
- 1738 U S 52
- 241 Two Forts Rd
- 515 Pleasant Side Dr
- 165 Stoney Creek Way
- 512 Stoney Field Dr
- 498 Stoney Field Dr
- 116 Stoney Creek Way
- 115 Stoney Creek Way
- 0 State Road S-8-357
- 302 Owl Watch Way
- 271 Emerald Isle Dr
- 417 Crystal Oaks Ln
- 227 Creek Pointe Dr
- 225 Creek Pointe Dr
- 229 Creek Pointe Dr
- 501 Sagebrush Ct
- 223 Creek Pointe Dr
- 510 Evening Shade Dr
- 221 Creek Pointe Dr
- 121 Sugeree Dr
- 541 Pleasant Side Dr
- 541 Pleasant Unit Dr
- 545 Pleasant Side Dr
- 539 Pleasant Side Dr
- 544 Pleasant Side Dr
- 542 Pleasant Side Dr
- 548 Pleasant Side Dr
- 537 Pleasant Side Dr
- 540 Pleasant Side Dr
- 549 Pleasant Side Dr
- 538 Pleasant Side Dr
- 535 Pleasant Unit Dr
- 535 Pleasant Unit Drive
- 535 Pleasant Side Dr
- 226 Two Forts Rd
- 224 Two Forts Rd Unit 133
- 224 Two Forts Rd
- 551 Pleasant Side Dr
- 228 Two Forts Rd
- 536 Pleasant Side Dr