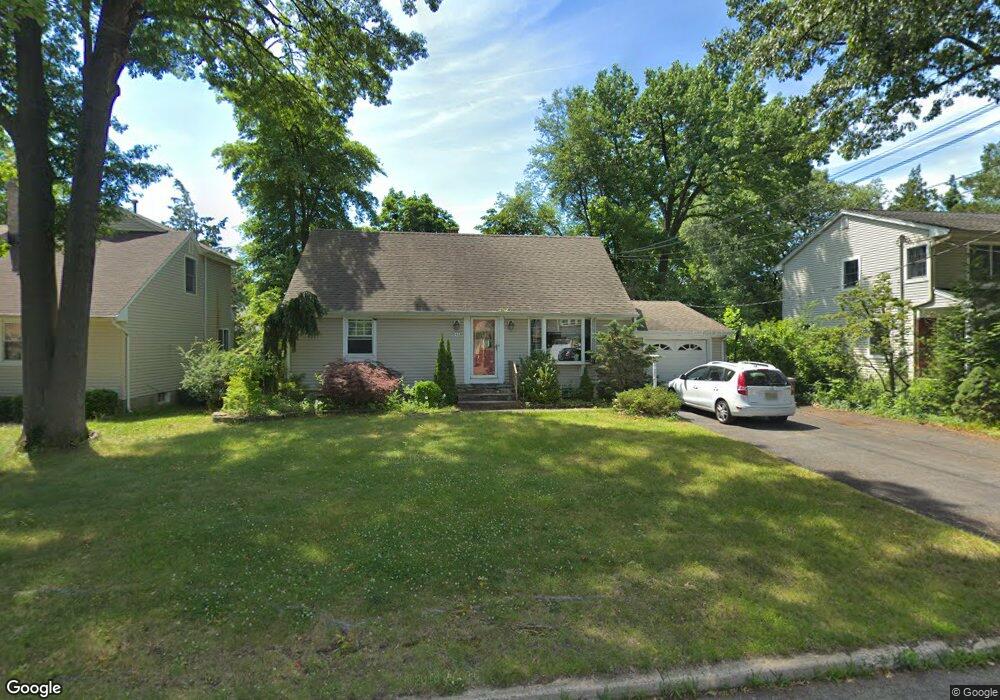
543 Salem St Paramus, NJ 07652
Estimated Value: $746,994 - $959,000
Studio
--
Bath
1,459
Sq Ft
$604/Sq Ft
Est. Value
About This Home
This home is located at 543 Salem St, Paramus, NJ 07652 and is currently estimated at $881,249, approximately $604 per square foot. 543 Salem St is a home located in Bergen County with nearby schools including Paramus High School and Bergen Catholic High School.
Ownership History
Date
Name
Owned For
Owner Type
Purchase Details
Closed on
Oct 3, 2005
Sold by
Bleier John
Bought by
Chang Samuel and Chang Byeong Ah
Current Estimated Value
Home Financials for this Owner
Home Financials are based on the most recent Mortgage that was taken out on this home.
Original Mortgage
$416,500
Outstanding Balance
$223,632
Interest Rate
5.81%
Estimated Equity
$657,617
Purchase Details
Closed on
Sep 21, 2000
Bought by
Bleier Loretta
Home Financials for this Owner
Home Financials are based on the most recent Mortgage that was taken out on this home.
Original Mortgage
$35,000
Interest Rate
7.81%
Create a Home Valuation Report for This Property
The Home Valuation Report is an in-depth analysis detailing your home's value as well as a comparison with similar homes in the area
Home Values in the Area
Average Home Value in this Area
Purchase History
| Date | Buyer | Sale Price | Title Company |
|---|---|---|---|
| Chang Samuel | $595,000 | -- | |
| Bleier Loretta | -- | -- | |
| Bleier Loretta | -- | -- |
Source: Public Records
Mortgage History
| Date | Status | Borrower | Loan Amount |
|---|---|---|---|
| Open | Chang Samuel | $416,500 | |
| Previous Owner | Bleier Loretta | $35,000 |
Source: Public Records
Tax History
| Year | Tax Paid | Tax Assessment Tax Assessment Total Assessment is a certain percentage of the fair market value that is determined by local assessors to be the total taxable value of land and additions on the property. | Land | Improvement |
|---|---|---|---|---|
| 2025 | $8,269 | $584,100 | $375,600 | $208,500 |
| 2024 | $8,023 | $546,200 | $347,100 | $199,100 |
| 2023 | $7,599 | $523,000 | $330,400 | $192,600 |
| 2022 | $7,599 | $489,600 | $307,800 | $181,800 |
| 2021 | $7,041 | $457,200 | $289,400 | $167,800 |
| 2020 | $7,184 | $450,400 | $284,400 | $166,000 |
| 2019 | $6,817 | $367,300 | $250,300 | $117,000 |
| 2018 | $6,733 | $367,300 | $250,300 | $117,000 |
| 2017 | $6,615 | $367,300 | $250,300 | $117,000 |
| 2016 | $6,435 | $367,300 | $250,300 | $117,000 |
| 2015 | $6,369 | $367,300 | $250,300 | $117,000 |
| 2014 | $6,314 | $367,300 | $250,300 | $117,000 |
Source: Public Records
Map
Nearby Homes
- 454 E Ridgewood Ave
- 277 Columbia Terrace
- 6 Merrimack Ct
- 261 Idaho St
- 676 Ridgewood Rd
- 327 E Midland Ave
- 492 Oaktree Rd
- 216 E Midland Ave
- 922 Wildwood Rd
- 589 Fletcher Ave
- 624 West Dr
- 319 Franklin Place
- 366 Spring Valley Rd
- 378 S Terhune Ave
- 623 Alberta Dr
- 680 Soldier Hill Rd
- 719 Neill Ct
- 13 Fey Place
- 23 Fey Place
- 21 Fey Place
- 539 Salem St
- 545 Salem St
- 538 Burlington St
- 537 Salem St
- 544 Burlington St
- 540 Burlington St
- 547 Salem St
- 540 Salem St
- 544 Salem St
- 538 Salem St
- 550 Burlington St
- 536 Burlington St
- 546 Salem St
- 536 Salem St
- 551 Salem St
- 484 E Ridgewood Ave
- 533 Salem St
- 534 Salem St
- 545 Spring Valley Rd
- 547 Spring Valley Rd
Your Personal Tour Guide
Ask me questions while you tour the home.