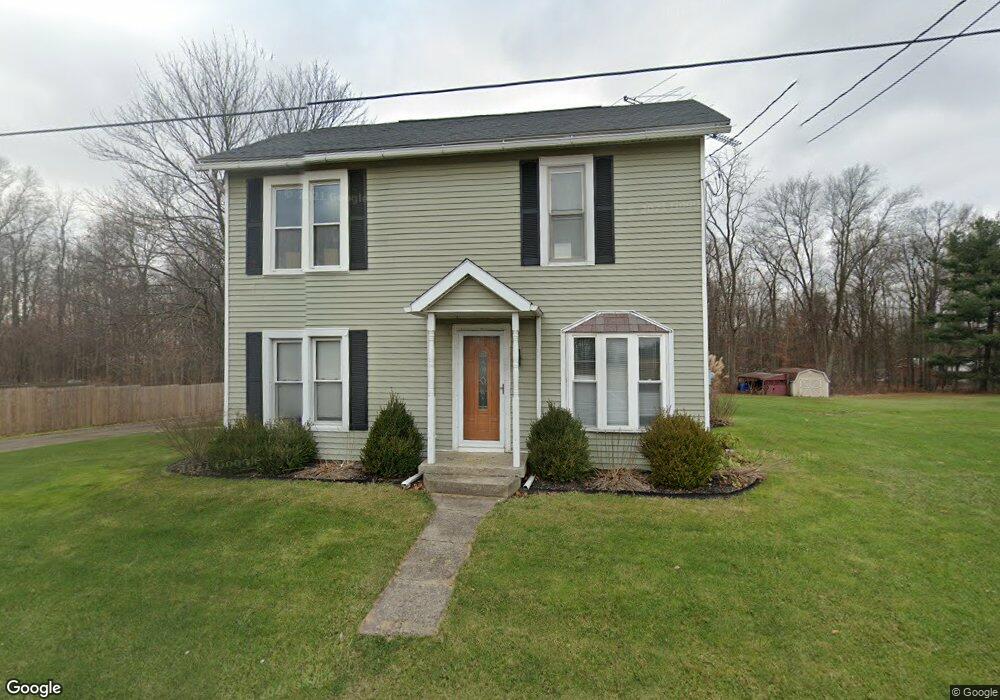
543 State Route 314 N Mansfield, OH 44903
Estimated Value: $169,132 - $205,000
3
Beds
1
Bath
1,336
Sq Ft
$137/Sq Ft
Est. Value
About This Home
This home is located at 543 State Route 314 N, Mansfield, OH 44903 and is currently estimated at $182,783, approximately $136 per square foot. 543 State Route 314 N is a home located in Richland County with nearby schools including Stingel Elementary School, Ontario Middle School, and Ontario High School.
Ownership History
Date
Name
Owned For
Owner Type
Purchase Details
Closed on
Nov 9, 2009
Sold by
Secretary Of Housing & Urban Development
Bought by
Stegall Joseph Michael
Current Estimated Value
Home Financials for this Owner
Home Financials are based on the most recent Mortgage that was taken out on this home.
Original Mortgage
$56,547
Outstanding Balance
$36,847
Interest Rate
4.96%
Mortgage Type
FHA
Estimated Equity
$145,936
Purchase Details
Closed on
Apr 8, 2009
Sold by
Midfirst Bank
Bought by
Secretary Of Housing & Urban Development
Purchase Details
Closed on
Apr 2, 2009
Sold by
Nelson James A
Bought by
Midfirst Bank
Purchase Details
Closed on
Nov 14, 2000
Sold by
Mckenna Melinda M
Bought by
Nelson James A
Home Financials for this Owner
Home Financials are based on the most recent Mortgage that was taken out on this home.
Original Mortgage
$72,412
Interest Rate
7.91%
Mortgage Type
FHA
Purchase Details
Closed on
Apr 15, 1993
Sold by
Spafford Marvin R
Bought by
Spafford Shirley L
Create a Home Valuation Report for This Property
The Home Valuation Report is an in-depth analysis detailing your home's value as well as a comparison with similar homes in the area
Home Values in the Area
Average Home Value in this Area
Purchase History
| Date | Buyer | Sale Price | Title Company |
|---|---|---|---|
| Stegall Joseph Michael | $42,400 | Lakeside Title | |
| Secretary Of Housing & Urban Development | -- | None Available | |
| Midfirst Bank | $79,970 | None Available | |
| Nelson James A | $72,450 | -- | |
| Spafford Shirley L | -- | -- |
Source: Public Records
Mortgage History
| Date | Status | Borrower | Loan Amount |
|---|---|---|---|
| Open | Stegall Joseph Michael | $56,547 | |
| Previous Owner | Nelson James A | $72,412 |
Source: Public Records
Tax History Compared to Growth
Tax History
| Year | Tax Paid | Tax Assessment Tax Assessment Total Assessment is a certain percentage of the fair market value that is determined by local assessors to be the total taxable value of land and additions on the property. | Land | Improvement |
|---|---|---|---|---|
| 2024 | $1,771 | $34,760 | $6,810 | $27,950 |
| 2023 | $1,771 | $34,760 | $6,810 | $27,950 |
| 2022 | $1,648 | $27,850 | $6,200 | $21,650 |
| 2021 | $1,651 | $27,850 | $6,200 | $21,650 |
| 2020 | $1,763 | $27,850 | $6,200 | $21,650 |
| 2019 | $1,687 | $24,120 | $5,250 | $18,870 |
| 2018 | $1,438 | $24,120 | $5,250 | $18,870 |
| 2017 | $988 | $24,120 | $5,250 | $18,870 |
| 2016 | $561 | $9,500 | $5,090 | $4,410 |
| 2015 | $560 | $9,500 | $5,090 | $4,410 |
| 2014 | $561 | $9,500 | $5,090 | $4,410 |
| 2012 | $256 | $9,500 | $5,250 | $4,250 |
Source: Public Records
Map
Nearby Homes
- 832 State Route 314 N
- 0 Rudy Rd
- 3880 Horizon Dr
- 0 Alexander Dr
- 56 Lexington Ontario Rd
- 3541 Oakstone Dr
- 3436 Ridgestone Ct
- 3320 Oakstone Dr
- 3308 Park Ave W
- 3516 Muirfield
- 3516 Muirfield Dr
- 445 Rudy Rd
- 436 Joy Lynn Ln
- 1671 State Route 314 N
- 1085 Lewis Rd
- 4825 Lincoln Hwy
- 1689 State Route 314
- 1689 Ohio 314
- 4451 Beam Rd
- 2908 Millsboro Rd E
- 567 Ohio 314
- 567 State Route 314 N
- 531 State Route 314 N
- 567 State Route 314 N
- 298 Ohio 314
- 524 State Route 314 S
- 587 State Route 314 N
- 614 Ohio 314
- 614 State Route 314 N
- 629 State Route 314 N
- 466 State Route 314 S
- 466 Ohio 314
- 605 State Route 314 N
- 671 State Route 314 N
- 671 Ohio 314
- 684 State Route 314 N
- 684 State Route 314 S
- 684 Ohio 314
- 693 State Route 314 N Unit 695
- 693-695 Oh-314