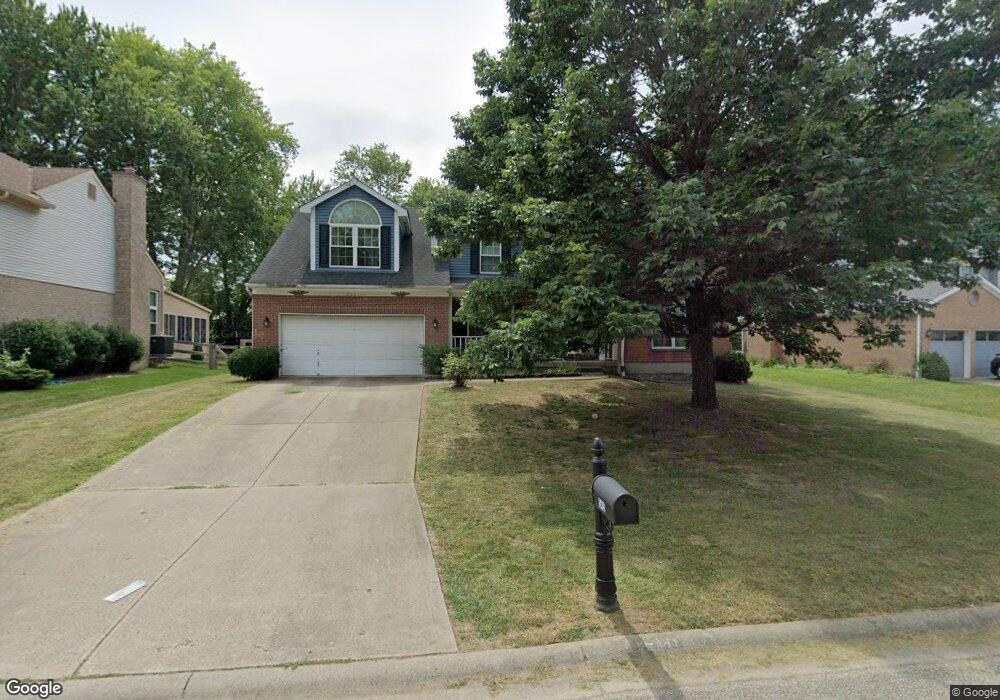
543 Sugar Maple Ct Cincinnati, OH 45255
Estimated Value: $421,000 - $451,987
5
Beds
4
Baths
2,804
Sq Ft
$157/Sq Ft
Est. Value
About This Home
This home is located at 543 Sugar Maple Ct, Cincinnati, OH 45255 and is currently estimated at $440,247, approximately $157 per square foot. 543 Sugar Maple Ct is a home located in Clermont County with nearby schools including Withamsville-Tobasco Elementary School, West Clermont Middle School, and West Clermont High School.
Ownership History
Date
Name
Owned For
Owner Type
Purchase Details
Closed on
Jul 28, 2003
Sold by
Deavers Tara
Bought by
Deavers William D
Current Estimated Value
Home Financials for this Owner
Home Financials are based on the most recent Mortgage that was taken out on this home.
Original Mortgage
$143,200
Outstanding Balance
$61,634
Interest Rate
5.31%
Mortgage Type
Purchase Money Mortgage
Estimated Equity
$378,613
Purchase Details
Closed on
Jun 14, 2002
Sold by
Reynolds William L
Bought by
Deavers William D and Deavers Tara
Home Financials for this Owner
Home Financials are based on the most recent Mortgage that was taken out on this home.
Original Mortgage
$140,000
Interest Rate
6.87%
Mortgage Type
New Conventional
Purchase Details
Closed on
Jul 7, 1992
Purchase Details
Closed on
Dec 12, 1991
Create a Home Valuation Report for This Property
The Home Valuation Report is an in-depth analysis detailing your home's value as well as a comparison with similar homes in the area
Home Values in the Area
Average Home Value in this Area
Purchase History
| Date | Buyer | Sale Price | Title Company |
|---|---|---|---|
| Deavers William D | -- | -- | |
| Deavers William D | $175,000 | -- | |
| -- | $53,300 | -- | |
| -- | $147,500 | -- |
Source: Public Records
Mortgage History
| Date | Status | Borrower | Loan Amount |
|---|---|---|---|
| Open | Deavers William D | $143,200 | |
| Closed | Deavers William D | $140,000 | |
| Closed | Deavers William D | $17,900 |
Source: Public Records
Tax History Compared to Growth
Tax History
| Year | Tax Paid | Tax Assessment Tax Assessment Total Assessment is a certain percentage of the fair market value that is determined by local assessors to be the total taxable value of land and additions on the property. | Land | Improvement |
|---|---|---|---|---|
| 2024 | $6,019 | $119,350 | $18,970 | $100,380 |
| 2023 | $6,028 | $119,350 | $18,970 | $100,380 |
| 2022 | $5,380 | $92,330 | $14,700 | $77,630 |
| 2021 | $5,402 | $92,330 | $14,700 | $77,630 |
| 2020 | $5,408 | $92,330 | $14,700 | $77,630 |
| 2019 | $4,105 | $81,940 | $14,210 | $67,730 |
| 2018 | $4,147 | $81,940 | $14,210 | $67,730 |
| 2017 | $3,665 | $81,940 | $14,210 | $67,730 |
| 2016 | $3,665 | $65,560 | $11,380 | $54,180 |
| 2015 | $3,558 | $65,560 | $11,380 | $54,180 |
| 2014 | $3,556 | $65,560 | $11,380 | $54,180 |
| 2013 | $3,578 | $65,250 | $11,380 | $53,870 |
Source: Public Records
Map
Nearby Homes
- 493 Mcintosh Dr
- 4182 Mount Carmel Tobasco Rd
- 482 Sanctuary Way
- 486 Sanctuary Way
- 488 Sanctuary Way
- 490 Sanctuary Way
- 492 Sanctuary Way
- 494 Sanctuary Way
- 496 Sanctuary Way
- 498 Sanctuary Way
- 477 Sanctuary Way
- 477 Sanctuary Way Unit 23
- 475 Sanctuary Way
- 439 Mcintosh Dr
- 473 Sanctuary Way
- 471 Sanctuary Way
- 457 Courtland Place Unit 28D
- 4342 Motivation Path
- 4340 Motivation Path
- Hudson Plan at Twelve Oaks - Paired Patio Homes Collection
- 541 Sugar Maple Ct
- 545 Sugar Maple Ct
- 539 Sugar Maple Ct
- 547 Sugar Maple Ct
- 544 Sugar Maple Ct
- 542 Sugar Maple Ct
- 537 Sugar Maple Ct
- 4208 Maple Dale Ln
- 546 Sugar Maple Ct
- 549 Sugar Maple Ct
- 535 Sugar Maple Ct
- 4207 Maple Dale Ln
- 548 Sugar Maple Ct
- 551 Sugar Maple Ct
- 545 Hamblin Dr
- 4212 Maple Dale Ln
- 534 Sugar Maple Ct
- 280 Jonathan Ct
- 547 Hamblin Dr
- 286 Jonathan Ct