Estimated Value: $701,303 - $771,000
4
Beds
5
Baths
4,617
Sq Ft
$158/Sq Ft
Est. Value
About This Home
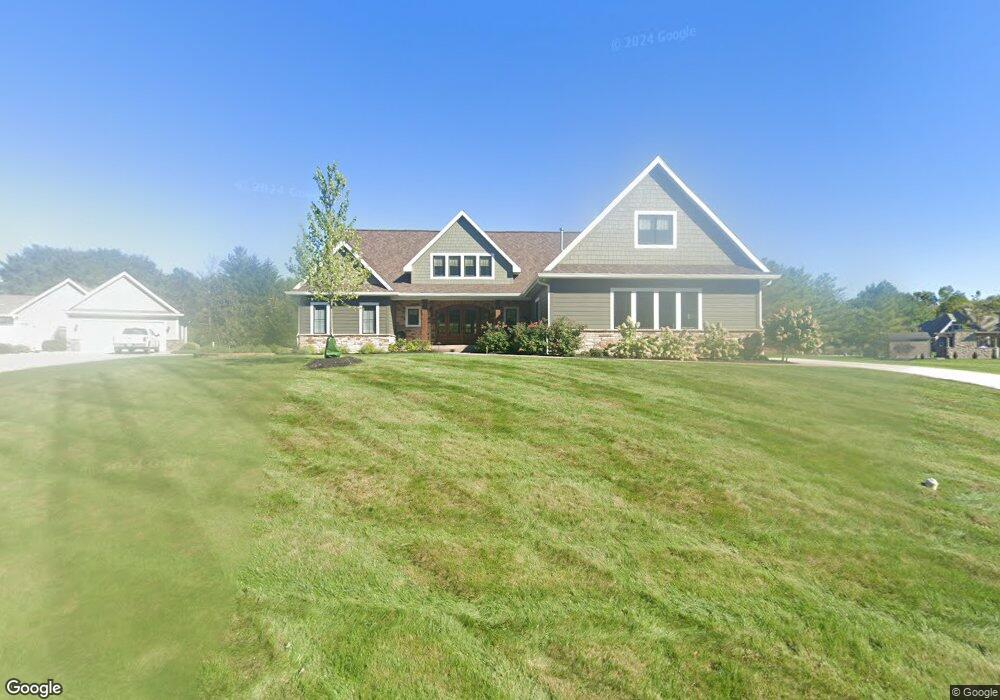
This home is located at 543 Tonkawa Trail, Lima, OH 45805 and is currently estimated at $730,434, approximately $158 per square foot. 543 Tonkawa Trail is a home with nearby schools including Maplewood Elementary School, Elmwood Elementary School, and Shawnee Middle School.
Ownership History
Date
Name
Owned For
Owner Type
Purchase Details
Closed on
Sep 16, 2020
Sold by
Joyce Todd P and Joyce Tara M
Bought by
Hawk Janet C
Current Estimated Value
Purchase Details
Closed on
Mar 23, 2018
Sold by
Keller Joshua and Keller Katherine
Bought by
Joyce Todd P and Joyce Tara M
Purchase Details
Closed on
Feb 21, 2014
Sold by
Joyce Todd P and Joyce Tara M
Bought by
Keller Joshua and Keller Katherine
Purchase Details
Closed on
May 29, 2013
Sold by
Bargainnier Kelly Jo
Bought by
Joyce Todd P and Joyce Tara M
Purchase Details
Closed on
Jan 17, 2013
Sold by
Bargainnier David R
Bought by
Bargainnier Kelly Jo
Home Financials for this Owner
Home Financials are based on the most recent Mortgage that was taken out on this home.
Original Mortgage
$345,000
Interest Rate
3.31%
Mortgage Type
Adjustable Rate Mortgage/ARM
Create a Home Valuation Report for This Property
The Home Valuation Report is an in-depth analysis detailing your home's value as well as a comparison with similar homes in the area
Home Values in the Area
Average Home Value in this Area
Purchase History
| Date | Buyer | Sale Price | Title Company |
|---|---|---|---|
| Hawk Janet C | $31,000 | None Available | |
| Hawk Janet C | -- | None Listed On Document | |
| Joyce Todd P | -- | None Available | |
| Keller Joshua | $31,000 | None Available | |
| Joyce Todd P | $12,000 | None Available | |
| Bargainnier Kelly Jo | -- | None Available |
Source: Public Records
Mortgage History
| Date | Status | Borrower | Loan Amount |
|---|---|---|---|
| Previous Owner | Bargainnier Kelly Jo | $345,000 |
Source: Public Records
Tax History Compared to Growth
Tax History
| Year | Tax Paid | Tax Assessment Tax Assessment Total Assessment is a certain percentage of the fair market value that is determined by local assessors to be the total taxable value of land and additions on the property. | Land | Improvement |
|---|---|---|---|---|
| 2024 | $9,731 | $219,840 | $15,120 | $204,720 |
| 2023 | $8,979 | $180,180 | $12,390 | $167,790 |
| 2022 | $7,491 | $146,230 | $12,390 | $133,840 |
| 2021 | $524 | $9,910 | $9,910 | $0 |
| 2020 | $606 | $11,870 | $11,870 | $0 |
| 2019 | $606 | $11,870 | $11,870 | $0 |
| 2018 | $614 | $11,870 | $11,870 | $0 |
| 2017 | $624 | $11,870 | $11,870 | $0 |
| 2016 | $606 | $11,870 | $11,870 | $0 |
| 2015 | $566 | $11,870 | $11,870 | $0 |
| 2014 | $566 | $10,920 | $10,920 | $0 |
| 2013 | $513 | $10,920 | $10,920 | $0 |
Source: Public Records
Map
Nearby Homes
- 550 Tonkawa Trail
- 4803 Kitamat Trail
- 4875 Wenatchi Trail
- 845 Atalan Trail
- 251 Timberfield Dr N
- 200 Fraunfelter Rd S
- 1340 Wonderlick Rd
- 00 Seriff
- 1440 Riverview Dr
- 0 Springview Dr
- 3390 Spencerville Rd
- 3948 Chestnut Oak Trail
- 2925 Koop Rd
- 2940 Koop Rd
- 1446 Adak Ave
- 2956 W High St
- 1424 Loch Loman Way
- 0 Colonial Ln
- 1453 W Shore Dr
- 2992 Autumn Leaves Ct
- 0000 Tonkawa Trail
- 568 Tonkawa Trail
- 000 Tonkawa Trail
- 579 Tonkawa Trail
- 539 Wakashan Trail
- 4688 Tillamook Trail
- 4700 Tillamook Trail
- 555 Wakashan Trail
- 527 Tonkawa Trail
- 4718 Tillamook Trail
- 502 Tonkawa Trail
- 564 Keresan Trail
- 522 Keresan Trail
- 565 Wakashan Trail
- 576 Keresan Trail
- 509 Wakashan Trail
- 4673 Tillamook Trail