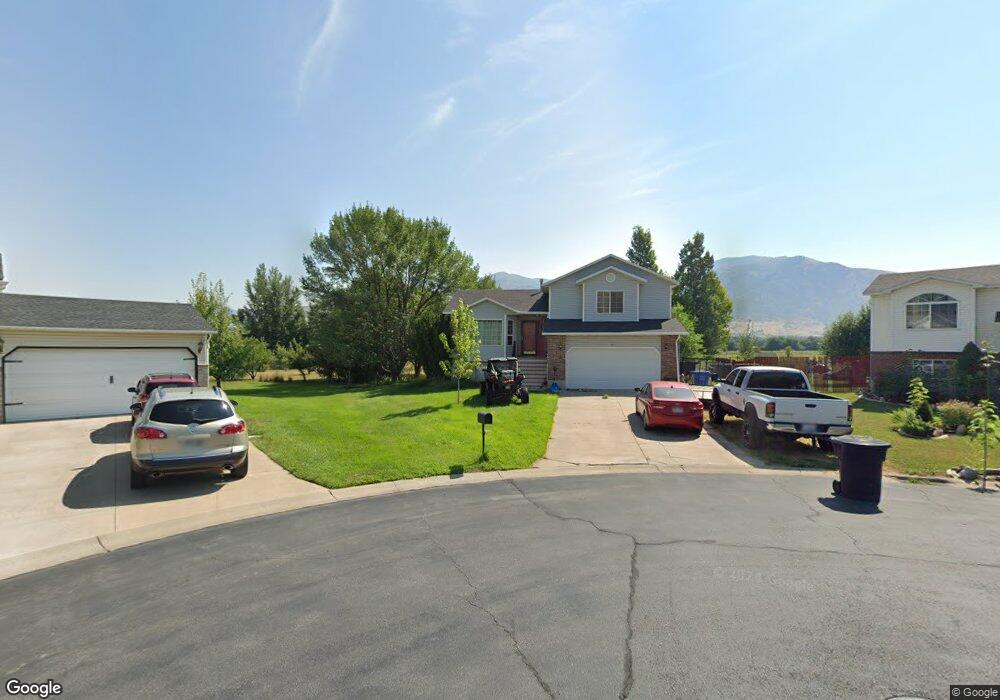
543 W 2700 S Nibley, UT 84321
Estimated Value: $440,000 - $476,000
4
Beds
3
Baths
1,969
Sq Ft
$235/Sq Ft
Est. Value
About This Home
This home is located at 543 W 2700 S, Nibley, UT 84321 and is currently estimated at $462,679, approximately $234 per square foot. 543 W 2700 S is a home located in Cache County with nearby schools including Nibley School, Spring Creek Middle School, and South Cache Middle School.
Ownership History
Date
Name
Owned For
Owner Type
Purchase Details
Closed on
Oct 24, 2019
Sold by
Decoursey Mark C and Decoursey Tami
Bought by
Gregory Daniel J and Gregory Jessica
Current Estimated Value
Home Financials for this Owner
Home Financials are based on the most recent Mortgage that was taken out on this home.
Original Mortgage
$274,928
Outstanding Balance
$244,477
Interest Rate
4.37%
Mortgage Type
FHA
Estimated Equity
$218,202
Purchase Details
Closed on
May 18, 2007
Sold by
Hatch David A and Hatch Michelle
Bought by
Decoursey Mark C and Decoursey Tami
Home Financials for this Owner
Home Financials are based on the most recent Mortgage that was taken out on this home.
Original Mortgage
$35,900
Interest Rate
6.12%
Mortgage Type
Stand Alone Second
Create a Home Valuation Report for This Property
The Home Valuation Report is an in-depth analysis detailing your home's value as well as a comparison with similar homes in the area
Home Values in the Area
Average Home Value in this Area
Purchase History
| Date | Buyer | Sale Price | Title Company |
|---|---|---|---|
| Gregory Daniel J | -- | American Secure Title Logan | |
| Decoursey Mark C | -- | Pinnacle Title Ins Agency |
Source: Public Records
Mortgage History
| Date | Status | Borrower | Loan Amount |
|---|---|---|---|
| Open | Gregory Daniel J | $274,928 | |
| Previous Owner | Decoursey Mark C | $35,900 | |
| Previous Owner | Decoursey Mark C | $143,600 |
Source: Public Records
Tax History Compared to Growth
Tax History
| Year | Tax Paid | Tax Assessment Tax Assessment Total Assessment is a certain percentage of the fair market value that is determined by local assessors to be the total taxable value of land and additions on the property. | Land | Improvement |
|---|---|---|---|---|
| 2025 | $1,637 | $216,945 | $0 | $0 |
| 2024 | $1,735 | $215,915 | $0 | $0 |
| 2023 | $1,815 | $211,475 | $0 | $0 |
| 2022 | $1,889 | $211,475 | $0 | $0 |
| 2021 | $1,856 | $322,760 | $75,800 | $246,960 |
| 2020 | $1,477 | $244,425 | $75,800 | $168,625 |
| 2019 | $1,549 | $244,424 | $75,800 | $168,624 |
| 2018 | $1,254 | $193,130 | $46,500 | $146,630 |
| 2017 | $1,212 | $98,890 | $0 | $0 |
| 2016 | $1,226 | $98,890 | $0 | $0 |
| 2015 | $1,056 | $85,735 | $0 | $0 |
| 2014 | $1,032 | $85,735 | $0 | $0 |
| 2013 | -- | $89,860 | $0 | $0 |
Source: Public Records
Map
Nearby Homes
- 2615 S 600 W
- 2938 S 600 W
- 3074 S 800 W
- 406 W 3025 S
- 2616 S 900 W
- 374 Ropelato Dr
- 400 W 3085 S
- 412 W 3085 S
- 269 W 2950 S
- 251 W 2950 S
- 225 W 2975 S
- 2269 Clear Creek Rd
- 907 W 2980 S
- 3085 225 West G204
- 3085 225 West G301
- 3085 225 West G302
- 3085 225 West G203
- 3085 225 West G202
- 3085 225 West G304
- Lyndhurst Plan at Ridgeline Park - Nibley (Active Adult)