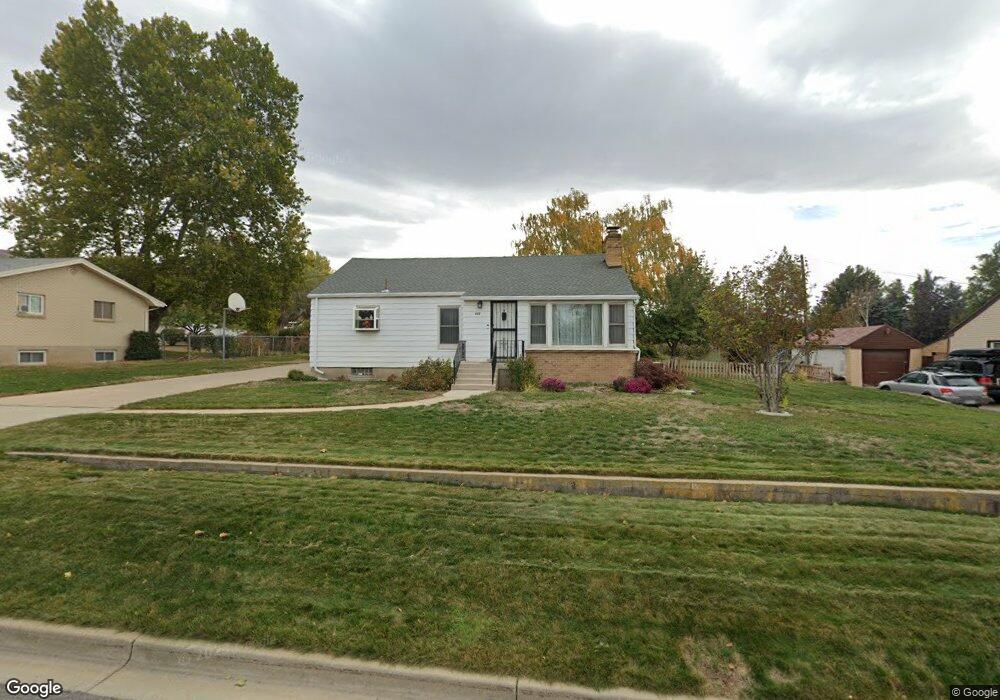
543 W 3000 S Bountiful, UT 84010
Estimated Value: $503,000 - $602,000
3
Beds
2
Baths
1,188
Sq Ft
$455/Sq Ft
Est. Value
About This Home
This home is located at 543 W 3000 S, Bountiful, UT 84010 and is currently estimated at $540,717, approximately $455 per square foot. 543 W 3000 S is a home located in Davis County with nearby schools including Adelaide School, South Davis Junior High School, and Woods Cross High School.
Ownership History
Date
Name
Owned For
Owner Type
Purchase Details
Closed on
Aug 19, 1996
Sold by
Bagley Lynne S
Bought by
Johnston Lynne B
Current Estimated Value
Purchase Details
Closed on
Mar 12, 1996
Sold by
Bagley Ann B and Brown Ann B
Bought by
Johnston Lynne B
Purchase Details
Closed on
Feb 27, 1996
Sold by
Stone Delene B
Bought by
Johnston Lynne B
Purchase Details
Closed on
Dec 29, 1970
Sold by
Bagley Ilene S
Bought by
Stone Delene B and Bagley Ann S
Create a Home Valuation Report for This Property
The Home Valuation Report is an in-depth analysis detailing your home's value as well as a comparison with similar homes in the area
Purchase History
| Date | Buyer | Sale Price | Title Company |
|---|---|---|---|
| Johnston Lynne B | -- | -- | |
| Johnston Lynne B | -- | -- | |
| Johnston Lynne B | -- | -- | |
| Stone Delene B | -- | -- |
Source: Public Records
Tax History
| Year | Tax Paid | Tax Assessment Tax Assessment Total Assessment is a certain percentage of the fair market value that is determined by local assessors to be the total taxable value of land and additions on the property. | Land | Improvement |
|---|---|---|---|---|
| 2025 | $2,957 | $260,150 | $191,112 | $69,038 |
| 2024 | $2,853 | $255,750 | $192,973 | $62,777 |
| 2023 | $2,740 | $442,000 | $333,721 | $108,279 |
| 2022 | $2,645 | $238,700 | $176,758 | $61,942 |
| 2021 | $2,476 | $343,000 | $232,185 | $110,815 |
| 2020 | $2,200 | $304,000 | $190,978 | $113,022 |
| 2019 | $2,161 | $296,000 | $158,097 | $137,903 |
| 2018 | $2,016 | $271,000 | $154,096 | $116,904 |
| 2016 | $1,537 | $122,870 | $75,374 | $47,496 |
| 2015 | $1,469 | $111,045 | $75,374 | $35,671 |
| 2014 | $1,442 | $111,490 | $75,374 | $36,116 |
| 2013 | -- | $106,663 | $51,555 | $55,108 |
Source: Public Records
Map
Nearby Homes
- 554 W 2900 S
- 552 W 2900 S
- 544 W 2900 S
- 527 Applewood Dr
- 558 Eastpointe Cir
- 468 W 3200 S
- 678 W 3200 S
- 3279 Plum Tree Ln
- 2749 S 450 W
- 337 W 2900 S
- 746 W 3200 S
- 652 W 3600 S
- 336 W 3500 S
- 683 Merlin St Unit 4630
- 298 Percival St Unit 354
- 141 W 3100 S
- 259 Lionel St Unit 373
- 785 Percival St
- 246 Galahad St
- 256 Excalibur St Unit 163
Your Personal Tour Guide
Ask me questions while you tour the home.