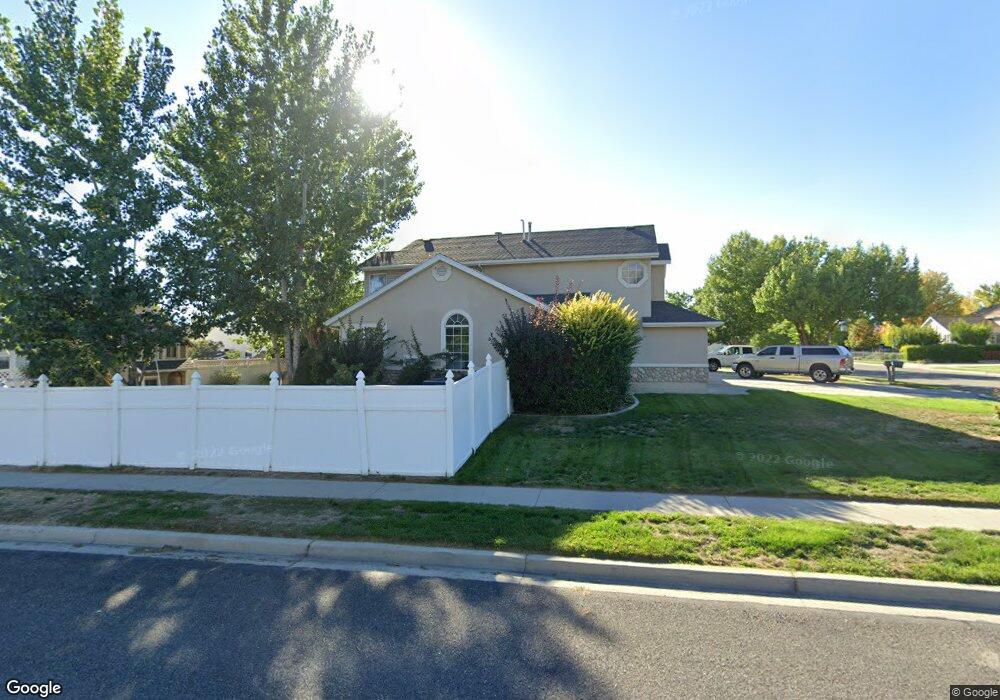
543 W 800 N American Fork, UT 84003
Estimated Value: $615,356 - $632,000
4
Beds
3
Baths
2,578
Sq Ft
$242/Sq Ft
Est. Value
About This Home
This home is located at 543 W 800 N, American Fork, UT 84003 and is currently estimated at $623,089, approximately $241 per square foot. 543 W 800 N is a home located in Utah County with nearby schools including Shelley Elementary School, American Fork Junior High School, and American Fork High School.
Ownership History
Date
Name
Owned For
Owner Type
Purchase Details
Closed on
Oct 4, 2016
Sold by
Woodbury Anthony A and Muri Angela
Bought by
Woodbury Atnhony A
Current Estimated Value
Home Financials for this Owner
Home Financials are based on the most recent Mortgage that was taken out on this home.
Original Mortgage
$232,900
Outstanding Balance
$186,594
Interest Rate
3.44%
Mortgage Type
New Conventional
Estimated Equity
$436,495
Purchase Details
Closed on
Feb 17, 2005
Sold by
Stone David M and Stone Leslie
Bought by
Woodbury Anthony and Woodbury Angela
Home Financials for this Owner
Home Financials are based on the most recent Mortgage that was taken out on this home.
Original Mortgage
$30,300
Interest Rate
5.66%
Mortgage Type
Credit Line Revolving
Purchase Details
Closed on
Nov 2, 2000
Sold by
Kalish Peter A and Kalish Kathleen A
Bought by
Stone David M and Stone Leslie
Create a Home Valuation Report for This Property
The Home Valuation Report is an in-depth analysis detailing your home's value as well as a comparison with similar homes in the area
Home Values in the Area
Average Home Value in this Area
Purchase History
| Date | Buyer | Sale Price | Title Company |
|---|---|---|---|
| Woodbury Atnhony A | -- | Access Title Co | |
| Woodbury Anthony | -- | Cottonwood Title | |
| Stone David M | -- | Associated Title Company |
Source: Public Records
Mortgage History
| Date | Status | Borrower | Loan Amount |
|---|---|---|---|
| Open | Woodbury Atnhony A | $232,900 | |
| Closed | Woodbury Anthony | $30,300 | |
| Closed | Woodbury Anthony | $161,600 |
Source: Public Records
Tax History Compared to Growth
Tax History
| Year | Tax Paid | Tax Assessment Tax Assessment Total Assessment is a certain percentage of the fair market value that is determined by local assessors to be the total taxable value of land and additions on the property. | Land | Improvement |
|---|---|---|---|---|
| 2025 | $2,555 | $300,300 | $221,400 | $324,600 |
| 2024 | $2,555 | $283,855 | $0 | $0 |
| 2023 | $2,443 | $287,760 | $0 | $0 |
| 2022 | $2,507 | $291,445 | $0 | $0 |
| 2021 | $2,148 | $390,000 | $158,900 | $231,100 |
| 2020 | $2,010 | $353,900 | $141,900 | $212,000 |
| 2019 | $1,858 | $338,500 | $131,200 | $207,300 |
| 2018 | $1,785 | $310,800 | $124,100 | $186,700 |
| 2017 | $1,713 | $160,985 | $0 | $0 |
| 2016 | $1,687 | $147,290 | $0 | $0 |
| 2015 | $1,646 | $136,400 | $0 | $0 |
| 2014 | $1,612 | $131,780 | $0 | $0 |
Source: Public Records
Map
Nearby Homes
- 602 W 860 N
- 914 N 400 W Unit A
- 987 N 410 W
- 3889 W 950 Cir N Unit 366
- 641 N 420 W
- 471 W 1040 N
- 984 N 300 W
- 962 N 780 St W Unit 508
- 974 N 780 St W Unit 509
- 916 N 780 St W Unit 501
- 822 W 800 St N Unit LOT319
- 822 N 860 W Unit 317
- 425 W 1120 N
- 344 W 1080 N
- 796 N 200 W
- 782 N 200 W
- 540 N 300 W
- 3935 W 1000 N Unit 438
- 3983 W 1000 N Unit 442
- 4007 W 1000 N