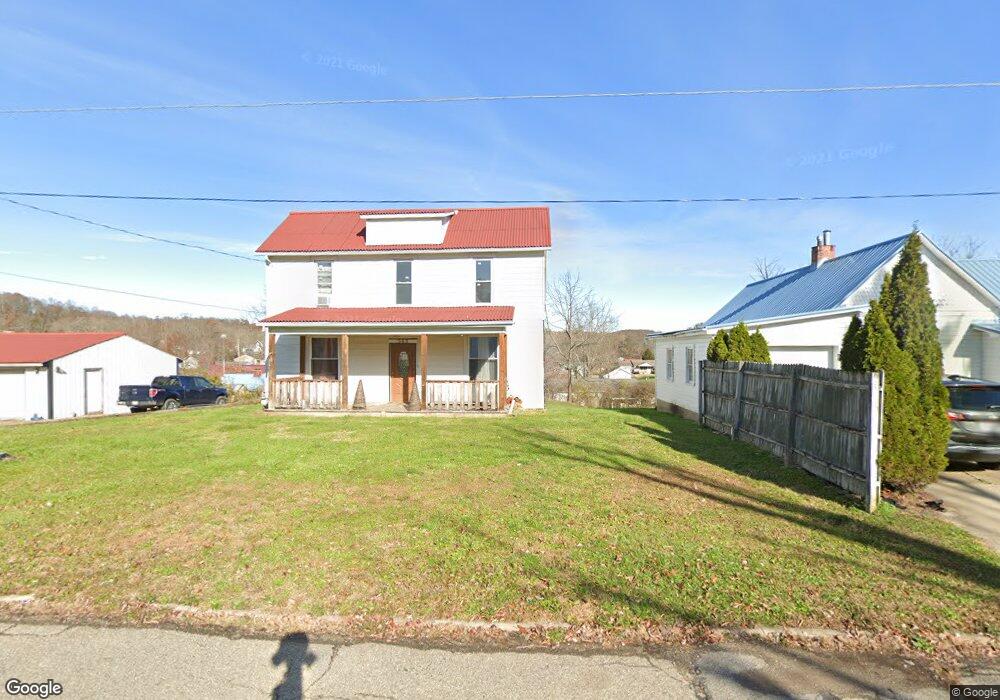
543 W A St Wellston, OH 45692
Estimated Value: $143,000 - $190,000
3
Beds
2
Baths
1,984
Sq Ft
$83/Sq Ft
Est. Value
About This Home
This home is located at 543 W A St, Wellston, OH 45692 and is currently estimated at $164,633, approximately $82 per square foot. 543 W A St is a home located in Jackson County with nearby schools including Bundy Elementary School, Wellston Intermediate School, and Wellston Middle School.
Ownership History
Date
Name
Owned For
Owner Type
Purchase Details
Closed on
Nov 21, 2022
Sold by
Bartoe Lori D
Bought by
Scarberry Lori D and Scarberry Brian A
Current Estimated Value
Home Financials for this Owner
Home Financials are based on the most recent Mortgage that was taken out on this home.
Original Mortgage
$95,595
Outstanding Balance
$92,631
Interest Rate
6.95%
Mortgage Type
New Conventional
Estimated Equity
$72,002
Purchase Details
Closed on
Feb 26, 2019
Sold by
Bartoe Joshua W and Bartoe Megan B
Bought by
Bartoe Bartoe Lori D Lori D and Bartoe Lori
Purchase Details
Closed on
Jan 21, 2011
Sold by
Bartoe Michael Wayne and Bartoe Fondaleigh
Bought by
Bartoe Joshua and Bartoe Lori
Purchase Details
Closed on
Oct 11, 2010
Sold by
Henry Willard and Henry Williard F
Bought by
Secretary Of Veterans Affairs
Purchase Details
Closed on
Sep 1, 2010
Sold by
Secretary Of Veterans Affairs
Bought by
Bartoe Michael Wayne
Purchase Details
Closed on
Jan 28, 2002
Sold by
Denny Robert E and Denny Patsy E
Bought by
Henry Willard
Create a Home Valuation Report for This Property
The Home Valuation Report is an in-depth analysis detailing your home's value as well as a comparison with similar homes in the area
Home Values in the Area
Average Home Value in this Area
Purchase History
| Date | Buyer | Sale Price | Title Company |
|---|---|---|---|
| Scarberry Lori D | $375 | Northwest Title | |
| Bartoe Bartoe Lori D Lori D | -- | None Available | |
| Bartoe Joshua | $16,000 | -- | |
| Secretary Of Veterans Affairs | -- | None Available | |
| Bartoe Michael Wayne | -- | Accuttile Agency Inc | |
| Henry Willard | $78,000 | -- |
Source: Public Records
Mortgage History
| Date | Status | Borrower | Loan Amount |
|---|---|---|---|
| Open | Scarberry Lori D | $95,595 |
Source: Public Records
Tax History Compared to Growth
Tax History
| Year | Tax Paid | Tax Assessment Tax Assessment Total Assessment is a certain percentage of the fair market value that is determined by local assessors to be the total taxable value of land and additions on the property. | Land | Improvement |
|---|---|---|---|---|
| 2024 | $1,191 | $32,230 | $4,540 | $27,690 |
| 2023 | $1,190 | $32,230 | $4,540 | $27,690 |
| 2022 | $1,214 | $25,670 | $3,890 | $21,780 |
| 2021 | $1,004 | $25,670 | $3,890 | $21,780 |
| 2020 | $1,028 | $25,670 | $3,890 | $21,780 |
| 2019 | $1,025 | $24,850 | $3,780 | $21,070 |
| 2018 | $994 | $24,850 | $3,780 | $21,070 |
| 2017 | $948 | $24,850 | $3,780 | $21,070 |
| 2016 | $1,994 | $21,110 | $2,100 | $19,010 |
| 2015 | $813 | $21,110 | $2,100 | $19,010 |
| 2013 | $242 | $6,580 | $2,100 | $4,480 |
| 2012 | $253 | $6,650 | $2,100 | $4,550 |
Source: Public Records
Map
Nearby Homes
- 552 W B St
- 629 W D St
- 21 S Michigan Ave
- 222 N Michigan Ave
- 238 S Wisconsin Ave
- 224 W 4th St
- 408 N Park Ave
- 16 E Broadway St
- 0 Womeldorf Ln
- 616 S Michigan Ave
- 224 E A St
- 1040 W Broadway St
- 224 E 2nd St
- 374 Exline Rd
- 416 S New York Ave
- 0 Cedar St
- 303 E 9th St
- 436 S Connecticut Ave
- 0 Ohio 327
- 1254 S New York Ave