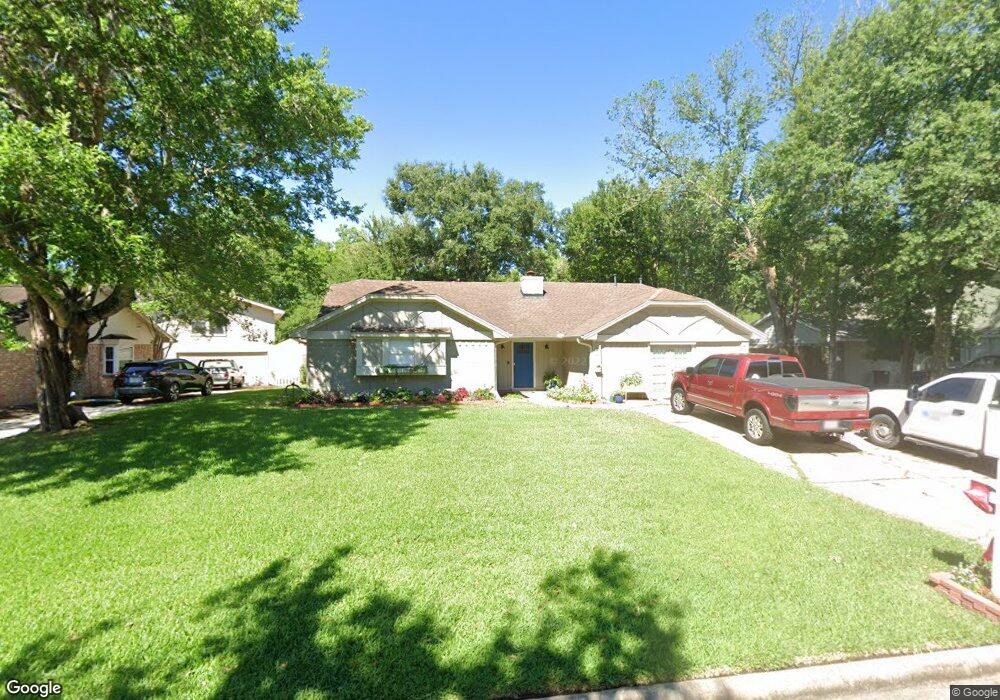
5430 Apple Blossom Ln Friendswood, TX 77546
Estimated Value: $332,123 - $376,000
3
Beds
2
Baths
2,472
Sq Ft
$146/Sq Ft
Est. Value
About This Home
This home is located at 5430 Apple Blossom Ln, Friendswood, TX 77546 and is currently estimated at $360,031, approximately $145 per square foot. 5430 Apple Blossom Ln is a home located in Harris County with nearby schools including Wedgewood Elementary School, Brookside Intermediate School, and Clear Brook High School.
Ownership History
Date
Name
Owned For
Owner Type
Purchase Details
Closed on
Jun 4, 2019
Sold by
Jrf Ventures Llc
Bought by
Karana Martin Dominic and Karana Martin
Current Estimated Value
Home Financials for this Owner
Home Financials are based on the most recent Mortgage that was taken out on this home.
Original Mortgage
$241,052
Outstanding Balance
$212,580
Interest Rate
4.25%
Mortgage Type
FHA
Estimated Equity
$147,451
Purchase Details
Closed on
Mar 23, 2018
Sold by
Gold Coast Equity Llc
Bought by
Jrf Venture Llc
Home Financials for this Owner
Home Financials are based on the most recent Mortgage that was taken out on this home.
Original Mortgage
$190,000
Interest Rate
4.38%
Mortgage Type
Commercial
Purchase Details
Closed on
Dec 15, 2016
Sold by
Fullen Dana and Weaver Tiffany Marie Fullen
Bought by
Fullen Diane W
Create a Home Valuation Report for This Property
The Home Valuation Report is an in-depth analysis detailing your home's value as well as a comparison with similar homes in the area
Home Values in the Area
Average Home Value in this Area
Purchase History
| Date | Buyer | Sale Price | Title Company |
|---|---|---|---|
| Karana Martin Dominic | -- | Fidelity National Title | |
| Jrf Venture Llc | -- | None Available | |
| Gold Coast Equity Llc | -- | None Available | |
| Fullen Diane W | -- | None Available |
Source: Public Records
Mortgage History
| Date | Status | Borrower | Loan Amount |
|---|---|---|---|
| Open | Karana Martin Dominic | $241,052 | |
| Previous Owner | Jrf Venture Llc | $190,000 |
Source: Public Records
Tax History Compared to Growth
Tax History
| Year | Tax Paid | Tax Assessment Tax Assessment Total Assessment is a certain percentage of the fair market value that is determined by local assessors to be the total taxable value of land and additions on the property. | Land | Improvement |
|---|---|---|---|---|
| 2025 | $5,185 | $345,653 | $63,740 | $281,913 |
| 2024 | $5,185 | $357,843 | $63,740 | $294,103 |
| 2023 | $5,185 | $390,906 | $63,740 | $327,166 |
| 2022 | $5,976 | $288,666 | $63,740 | $224,926 |
| 2021 | $5,728 | $259,096 | $59,538 | $199,558 |
| 2020 | $5,657 | $231,086 | $49,340 | $181,746 |
| 2019 | $5,679 | $221,169 | $39,519 | $181,650 |
| 2018 | $0 | $134,326 | $42,494 | $91,832 |
| 2017 | $4,326 | $179,556 | $42,494 | $137,062 |
| 2016 | $3,933 | $152,356 | $42,494 | $109,862 |
| 2015 | $1,809 | $152,356 | $42,494 | $109,862 |
| 2014 | $1,809 | $146,195 | $28,329 | $117,866 |
Source: Public Records
Map
Nearby Homes
- 5343 Royal Pkwy
- 5402 Royal Pkwy
- 5323 Abercreek Ave
- 5339 Appleblossom Ln
- 16303 Townes Rd
- Lots 29 and 42 Block Wedgewood Village Dr
- 5498 Apple Blossom Ln
- 14 Haverford Ln
- 16222 Forest Bend Ave
- 4311 Townes Forest Rd
- 16114 Forest Bend Ave
- 16607 David Glen Dr
- 16703 Hibiscus Ln
- 716 Penn Dr
- 16406 Blackhawk Blvd
- 16510 Blackhawk Blvd
- 16327 Blackhawk Blvd
- 4426 Saffron Ln
- 5131 Shady Oaks Ln
- 1303 Deepwood Dr
- 5430 Appleblossom Ln
- 5434 Apple Blossom Ln
- 5426 Appleblossom Ln
- 5434 Appleblossom Ln
- 5426 Apple Blossom Ln
- 5438 Apple Blossom Ln
- 5422 Appleblossom Ln
- 5438 Appleblossom Ln
- 5422 Apple Blossom Ln
- 5431 Apple Blossom Ln
- 5431 Appleblossom Ln
- 5435 Apple Blossom Ln
- 5435 Appleblossom Ln
- 5427 Apple Blossom Ln
- 5418 Apple Blossom Ln
- 5442 Apple Blossom Ln
- 5442 Appleblossom Ln
- 5439 Apple Blossom Ln
- 5423 Appleblossom Ln
- 5423 Apple Blossom Ln