5430 Jamies Oak Ct Cincinnati, OH 45248
Estimated Value: $406,000 - $489,000
4
Beds
3
Baths
3,154
Sq Ft
$142/Sq Ft
Est. Value
About This Home
This home is located at 5430 Jamies Oak Ct, Cincinnati, OH 45248 and is currently estimated at $447,255, approximately $141 per square foot. 5430 Jamies Oak Ct is a home located in Hamilton County with nearby schools including Charles W Springmyer Elementary School, Bridgetown Middle School, and Oak Hills High School.
Ownership History
Date
Name
Owned For
Owner Type
Purchase Details
Closed on
May 15, 2015
Sold by
Anderson Michael W and Parr Kimberly A
Bought by
Anderson Michael W
Current Estimated Value
Home Financials for this Owner
Home Financials are based on the most recent Mortgage that was taken out on this home.
Original Mortgage
$238,888
Outstanding Balance
$162,824
Interest Rate
3.93%
Mortgage Type
VA
Estimated Equity
$284,431
Purchase Details
Closed on
Jul 30, 2004
Sold by
Nvr Inc
Bought by
Anderson Michael W and Parr Kimberly A
Home Financials for this Owner
Home Financials are based on the most recent Mortgage that was taken out on this home.
Original Mortgage
$207,920
Interest Rate
5.5%
Mortgage Type
Fannie Mae Freddie Mac
Purchase Details
Closed on
Jan 28, 2004
Sold by
Nathaniel Development Co Inc
Bought by
Nvr Inc
Create a Home Valuation Report for This Property
The Home Valuation Report is an in-depth analysis detailing your home's value as well as a comparison with similar homes in the area
Home Values in the Area
Average Home Value in this Area
Purchase History
| Date | Buyer | Sale Price | Title Company |
|---|---|---|---|
| Anderson Michael W | $125,835 | Bchh Inc | |
| Anderson Michael W | $259,900 | Prominent Title Agency Llc | |
| Nvr Inc | $149,700 | -- |
Source: Public Records
Mortgage History
| Date | Status | Borrower | Loan Amount |
|---|---|---|---|
| Open | Anderson Michael W | $238,888 | |
| Closed | Anderson Michael W | $207,920 | |
| Closed | Anderson Michael W | $51,980 |
Source: Public Records
Tax History
| Year | Tax Paid | Tax Assessment Tax Assessment Total Assessment is a certain percentage of the fair market value that is determined by local assessors to be the total taxable value of land and additions on the property. | Land | Improvement |
|---|---|---|---|---|
| 2025 | $6,767 | $130,057 | $22,750 | $107,307 |
| 2023 | $6,605 | $130,057 | $22,750 | $107,307 |
| 2022 | $5,874 | $98,042 | $19,600 | $78,442 |
| 2021 | $5,274 | $98,042 | $19,600 | $78,442 |
| 2020 | $5,342 | $98,042 | $19,600 | $78,442 |
| 2019 | $5,228 | $87,539 | $17,500 | $70,039 |
| 2018 | $5,236 | $87,539 | $17,500 | $70,039 |
| 2017 | $4,935 | $87,539 | $17,500 | $70,039 |
| 2016 | $4,972 | $88,085 | $17,325 | $70,760 |
| 2015 | $5,016 | $88,085 | $17,325 | $70,760 |
| 2014 | $5,022 | $88,085 | $17,325 | $70,760 |
| 2013 | $4,739 | $88,974 | $17,500 | $71,474 |
Source: Public Records
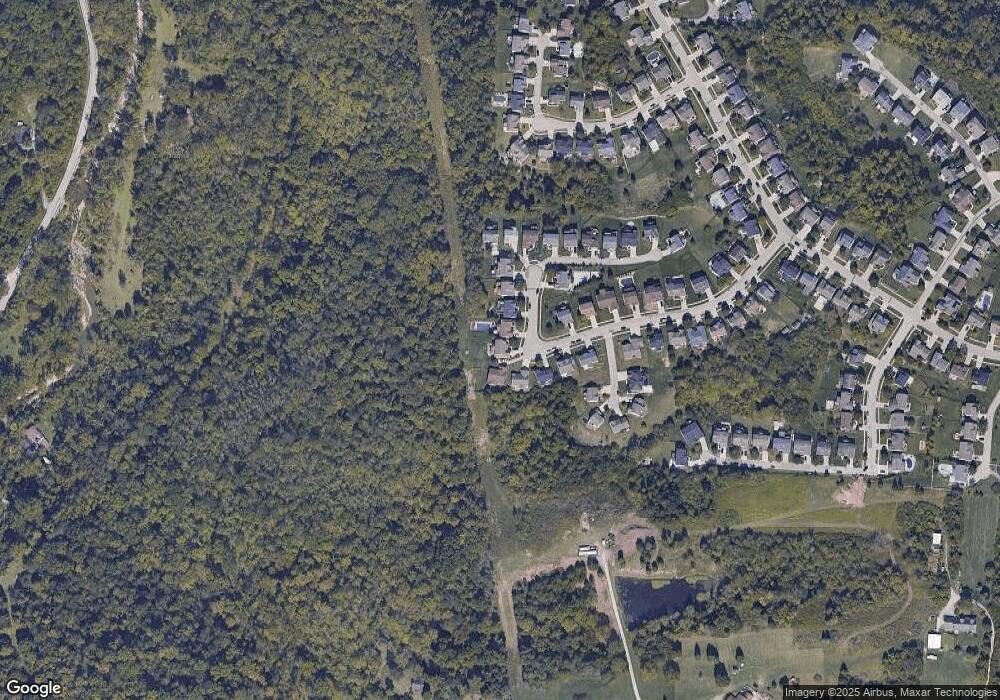
Map
Nearby Homes
- 6864 Ruwes Oak Dr
- 5632 Sarahs Oak Dr
- 6780 Harrison Ave
- 6793 Jennifer Lynn Dr
- 5473 Michelles Oak Ct
- 10 Priya Place
- 5725 Lofty View Ln Unit 1C
- 7787 Skyview Cir
- 6981 Saint Helens Ct
- 5310 Rybolt Rd
- 8060 Bridge Point Dr
- 7979 Oakbridge Way
- 8041 Oakbridge Way
- 7104 Wesselman Rd
- 6617 Hearne Rd
- 6765 Verde Ridge Dr Unit 20C
- 6586 Hearne Rd Unit 2T
- 6646 Hearne Rd
- 7072 Wesselman Rd
- 6321 Eagles Lake Dr Unit 19
- 5422 Jamies Oak Ct
- 5438 Jamies Oak Ct
- 5446 Jamies Oak Ct
- 5406 Jamies Oak Ct
- 5454 Jamies Oak Ct
- 5443 Jamies Oak Ct
- 5462 Jamies Oak Ct
- 5462 Jamies Oak Ct Unit 130
- 5400 Jamies Oak Ct
- 5405 Jamies Oak Ct
- 5471 Jamies Oak Ct
- 5470 Jamies Oak Ct
- 6961 Marias Oak Ct
- 5394 Jamies Oak Ct
- 5388 Jamies Oak Ct
- 5382 Jamies Oak Ct
- 5481 Jamies Oak Ct
- 6953 Marias Oak Ct
- 7026 Logans Oak Ct
- 5482 Jamies Oak Ct
Your Personal Tour Guide
Ask me questions while you tour the home.