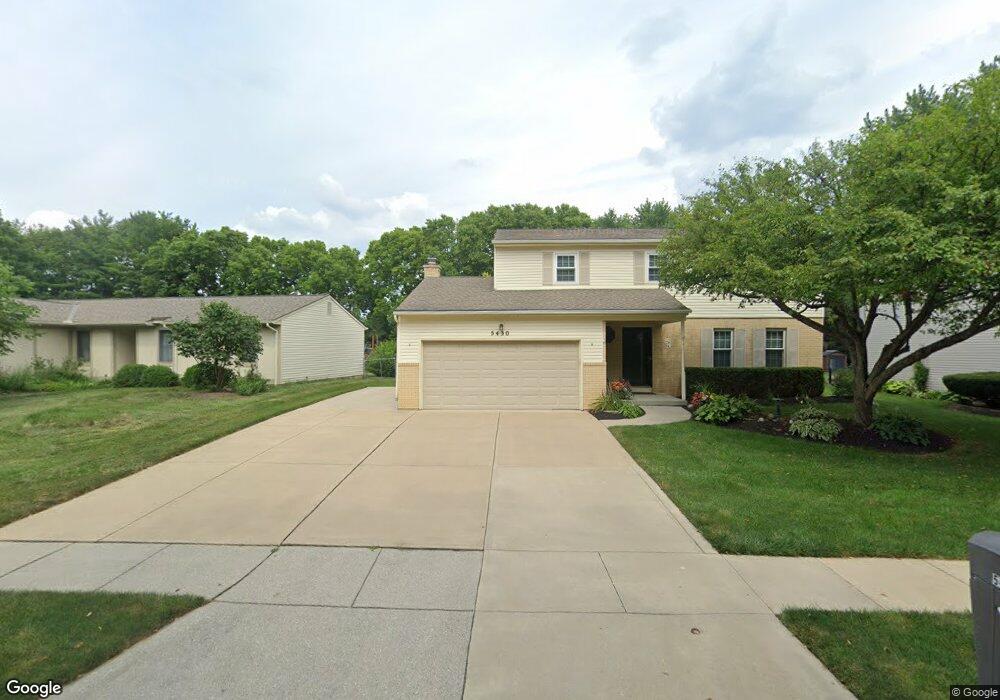
5430 Rockport St Columbus, OH 43235
Sycamore Hills NeighborhoodEstimated Value: $443,000 - $486,000
4
Beds
3
Baths
2,294
Sq Ft
$200/Sq Ft
Est. Value
About This Home
This home is located at 5430 Rockport St, Columbus, OH 43235 and is currently estimated at $458,678, approximately $199 per square foot. 5430 Rockport St is a home located in Franklin County with nearby schools including Gables Elementary School, Ridgeview Middle School, and Centennial High School.
Ownership History
Date
Name
Owned For
Owner Type
Purchase Details
Closed on
May 6, 2004
Sold by
Stemen Rodney L and Stemen Ellen M
Bought by
Stemen Rodney L and Stemen Ellen M
Current Estimated Value
Purchase Details
Closed on
Feb 27, 1999
Sold by
Wolf Ellen M and Wolf Ellen Marie
Bought by
Stemen Rodney L and Stemen Ellen M
Home Financials for this Owner
Home Financials are based on the most recent Mortgage that was taken out on this home.
Original Mortgage
$93,000
Outstanding Balance
$22,662
Interest Rate
6.83%
Estimated Equity
$436,016
Purchase Details
Closed on
May 31, 1983
Bought by
Wolf Ellen M
Create a Home Valuation Report for This Property
The Home Valuation Report is an in-depth analysis detailing your home's value as well as a comparison with similar homes in the area
Home Values in the Area
Average Home Value in this Area
Purchase History
| Date | Buyer | Sale Price | Title Company |
|---|---|---|---|
| Stemen Rodney L | -- | -- | |
| Stemen Rodney L | -- | Foundation Title Agency Inc | |
| Wolf Ellen M | -- | -- |
Source: Public Records
Mortgage History
| Date | Status | Borrower | Loan Amount |
|---|---|---|---|
| Open | Stemen Rodney L | $93,000 |
Source: Public Records
Tax History Compared to Growth
Tax History
| Year | Tax Paid | Tax Assessment Tax Assessment Total Assessment is a certain percentage of the fair market value that is determined by local assessors to be the total taxable value of land and additions on the property. | Land | Improvement |
|---|---|---|---|---|
| 2024 | $5,476 | $131,820 | $51,560 | $80,260 |
| 2023 | $5,434 | $131,820 | $51,560 | $80,260 |
| 2022 | $4,786 | $101,020 | $28,040 | $72,980 |
| 2021 | $4,794 | $101,020 | $28,040 | $72,980 |
| 2020 | $4,800 | $101,020 | $28,040 | $72,980 |
| 2019 | $4,345 | $80,370 | $22,440 | $57,930 |
| 2018 | $4,358 | $80,370 | $22,440 | $57,930 |
| 2017 | $4,342 | $80,370 | $22,440 | $57,930 |
| 2016 | $4,825 | $81,590 | $17,190 | $64,400 |
| 2015 | $4,380 | $81,590 | $17,190 | $64,400 |
| 2014 | $4,391 | $81,590 | $17,190 | $64,400 |
| 2013 | $2,050 | $77,700 | $16,380 | $61,320 |
Source: Public Records
Map
Nearby Homes
- 1246 Southport Dr
- 928 Linworth Village Dr
- 1213 Nantucket Ave
- 962 Augusta Glen Dr
- 5016 Postlewaite Rd Unit 5016
- 895 Linworth Village Dr
- 5363 Godown Rd
- 1161 Bethel Rd Unit 103/104
- 5773 Middlefield Dr
- 1147 Langland Dr
- 1505 Eastmeadow Place
- 5854 Aqua Bay Dr Unit 5854
- 1540 Slade Ave Unit 303
- 5881 Rocky Rill Rd
- 5936 Aqua Bay Dr
- 5938 Aqua Bay Dr
- 511 W Kanawha Ave
- 6041 Rocky Rill Rd
- 5111 Portland St
- 1558 Denbigh Dr
- 5440 Rockport St
- 5422 Rockport St
- 5414 Rockport St
- 5458 Rockport St
- 5425 Rockport St
- 1111 Middleport Dr
- 5441 Rockport St
- 5311 Castle Pines
- 5321 Castle Pines
- 5327 Castle Pines
- 5466 Rockport St
- 1132 Middleport Dr
- 5449 Rockport St
- 5313 Castle Pines
- 5319 Castle Pines
- 5329 Castle Pines
- 5303 Castle Pines
- 5305 Castle Pines
- 5335 Castle Pines
- 1117 Middleport Dr