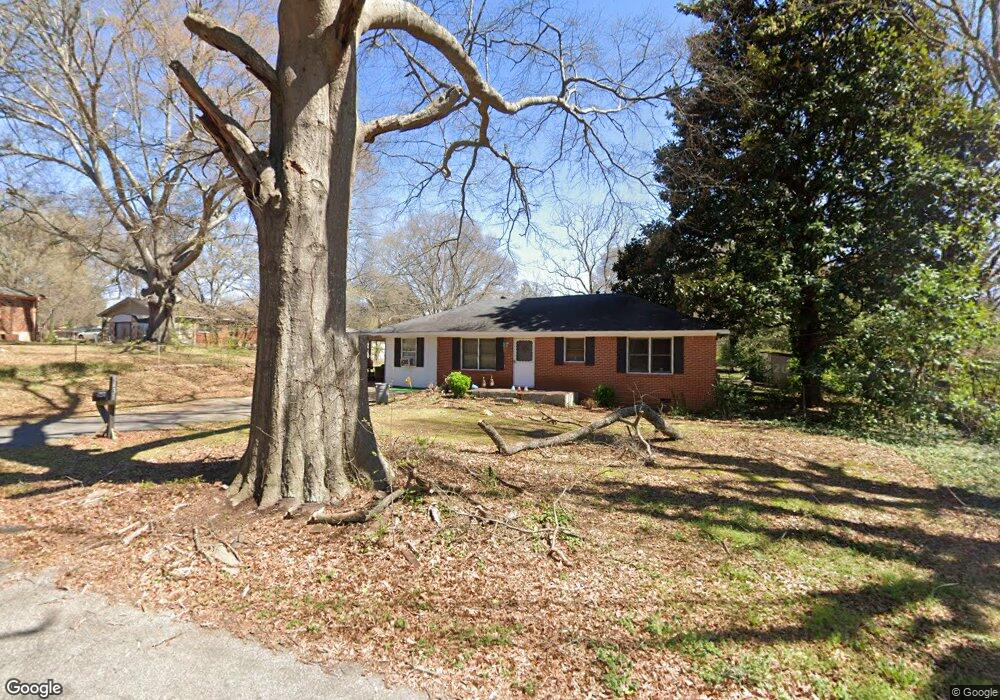
5431 Daniel St SW Mableton, GA 30126
Estimated Value: $204,039 - $264,000
3
Beds
1
Bath
975
Sq Ft
$234/Sq Ft
Est. Value
About This Home
This home is located at 5431 Daniel St SW, Mableton, GA 30126 and is currently estimated at $228,510, approximately $234 per square foot. 5431 Daniel St SW is a home located in Cobb County with nearby schools including Deerwood Elementary School, Mableton Elementary School, and Floyd Middle School.
Ownership History
Date
Name
Owned For
Owner Type
Purchase Details
Closed on
Sep 24, 2024
Sold by
Lavalais Stephen
Bought by
Lavalais Stephen and Griffin Catherine
Current Estimated Value
Home Financials for this Owner
Home Financials are based on the most recent Mortgage that was taken out on this home.
Original Mortgage
$127,187
Outstanding Balance
$125,724
Interest Rate
6.35%
Mortgage Type
FHA
Estimated Equity
$102,786
Purchase Details
Closed on
Aug 30, 2001
Sold by
Odum Daniel V and Odum Brenda A
Bought by
Lavalais Stephen
Home Financials for this Owner
Home Financials are based on the most recent Mortgage that was taken out on this home.
Original Mortgage
$110,650
Interest Rate
6.97%
Mortgage Type
New Conventional
Create a Home Valuation Report for This Property
The Home Valuation Report is an in-depth analysis detailing your home's value as well as a comparison with similar homes in the area
Home Values in the Area
Average Home Value in this Area
Purchase History
| Date | Buyer | Sale Price | Title Company |
|---|---|---|---|
| Lavalais Stephen | -- | Priority Title | |
| Lavalais Stephen | -- | Priority Title | |
| Lavalais Stephen | $116,500 | -- |
Source: Public Records
Mortgage History
| Date | Status | Borrower | Loan Amount |
|---|---|---|---|
| Open | Lavalais Stephen | $127,187 | |
| Closed | Lavalais Stephen | $127,187 | |
| Previous Owner | Lavalais Stephen | $110,650 |
Source: Public Records
Tax History Compared to Growth
Tax History
| Year | Tax Paid | Tax Assessment Tax Assessment Total Assessment is a certain percentage of the fair market value that is determined by local assessors to be the total taxable value of land and additions on the property. | Land | Improvement |
|---|---|---|---|---|
| 2025 | $1,511 | $72,380 | $28,000 | $44,380 |
| 2024 | $1,501 | $71,844 | $14,000 | $57,844 |
| 2023 | $981 | $71,844 | $14,000 | $57,844 |
| 2022 | $1,513 | $71,844 | $14,000 | $57,844 |
| 2021 | $883 | $43,020 | $12,000 | $31,020 |
| 2020 | $883 | $43,020 | $12,000 | $31,020 |
| 2019 | $752 | $37,040 | $9,600 | $27,440 |
| 2018 | $752 | $37,040 | $9,600 | $27,440 |
| 2017 | $675 | $34,576 | $9,600 | $24,976 |
| 2016 | $677 | $34,576 | $9,600 | $24,976 |
| 2015 | $537 | $27,604 | $9,600 | $18,004 |
| 2014 | $541 | $27,604 | $0 | $0 |
Source: Public Records
Map
Nearby Homes
- 814 Glennferry Bend SW
- 826 Glennferry Bend SW
- 5477 Blossomwood Trail SW
- 5527 Andrew Dr SW
- 5615 Hislop Ln Unit 82
- 1180 Deborah Dr SW
- 5205 Silhouette Ln SW
- 4397 Treadle Rd SW
- 5777 Whispering Pines Rd SW
- 1729 Hyssop Blvd
- 1275 Clay Rd SW
- 5531 Wild Cherry Dr SW
- 640 Monticello Dr SW
- 1047 Retner Dr SW
- 4976 Mable Lake Dr SW
- 1056 Retner Dr SW Unit 3
- 854 Joseph Club Dr SW
- 1576 Purple Coneflower Ave
- 1500 Purple Coneflower Ave
- 1504 Purple Coneflower Ave
- 1576 Purple Coneflower Ave
- 1540 Purple Coneflower Ave
- 1536 Purple Coneflower Ave
- 1532 Purple Coneflower Ave
- 1528 Purple Coneflower Ave
- 1592 Purple Coneflower Ave
- 1588 Purple Coneflower Ave
- 1580 Purple Coneflower Ave
- 1524 Purple Coneflower Ave
- 1584 Purple Coneflower Ave
- 1508 Purple Coneflower Ave
- 1512 Purple Coneflower Ave
- 1516 Purple Coneflower Ave
- 1520 Purple Coneflower Ave
- 1544 Purple Coneflower Ave
- 1035 Center St SW
- 1040 Mable St SW