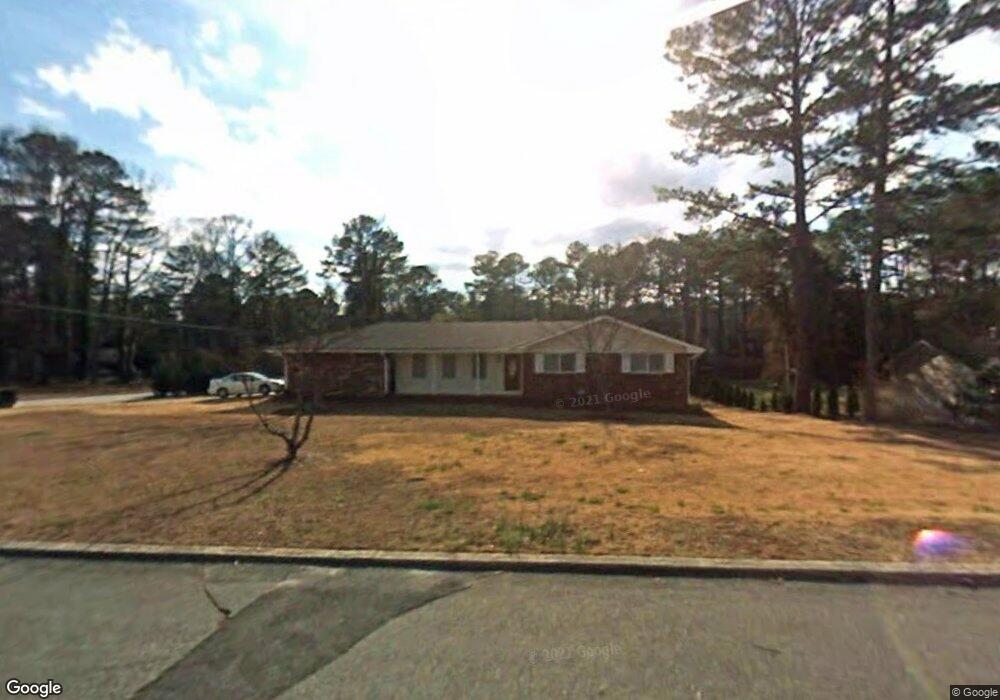
5431 Francis Dr SW Unit 1 Lilburn, GA 30047
Estimated Value: $304,153 - $345,000
3
Beds
2
Baths
1,401
Sq Ft
$231/Sq Ft
Est. Value
About This Home
This home is located at 5431 Francis Dr SW Unit 1, Lilburn, GA 30047 and is currently estimated at $324,038, approximately $231 per square foot. 5431 Francis Dr SW Unit 1 is a home located in Gwinnett County with nearby schools including Camp Creek Elementary School, Trickum Middle School, and Parkview High School.
Ownership History
Date
Name
Owned For
Owner Type
Purchase Details
Closed on
Mar 15, 2002
Sold by
Bloodworth Grove E
Bought by
Lin Quan
Current Estimated Value
Home Financials for this Owner
Home Financials are based on the most recent Mortgage that was taken out on this home.
Original Mortgage
$84,700
Outstanding Balance
$34,169
Interest Rate
6.86%
Mortgage Type
New Conventional
Estimated Equity
$289,869
Purchase Details
Closed on
Nov 4, 1998
Sold by
Dorteh Robert O
Bought by
Bloodworth Grover E
Home Financials for this Owner
Home Financials are based on the most recent Mortgage that was taken out on this home.
Original Mortgage
$72,900
Interest Rate
6.72%
Mortgage Type
New Conventional
Purchase Details
Closed on
Oct 30, 1998
Sold by
Heinrich Donna D
Bought by
Bloodworth Grover E
Home Financials for this Owner
Home Financials are based on the most recent Mortgage that was taken out on this home.
Original Mortgage
$72,900
Interest Rate
6.72%
Mortgage Type
New Conventional
Create a Home Valuation Report for This Property
The Home Valuation Report is an in-depth analysis detailing your home's value as well as a comparison with similar homes in the area
Home Values in the Area
Average Home Value in this Area
Purchase History
| Date | Buyer | Sale Price | Title Company |
|---|---|---|---|
| Lin Quan | $121,000 | -- | |
| Bloodworth Grover E | -- | -- | |
| Bloodworth Grover E | $91,000 | -- | |
| Bloodworth Grover E | -- | -- | |
| Bloodworth Grover E | -- | -- |
Source: Public Records
Mortgage History
| Date | Status | Borrower | Loan Amount |
|---|---|---|---|
| Open | Lin Quan | $84,700 | |
| Previous Owner | Bloodworth Grover E | $72,900 |
Source: Public Records
Tax History Compared to Growth
Tax History
| Year | Tax Paid | Tax Assessment Tax Assessment Total Assessment is a certain percentage of the fair market value that is determined by local assessors to be the total taxable value of land and additions on the property. | Land | Improvement |
|---|---|---|---|---|
| 2025 | -- | $112,040 | $22,200 | $89,840 |
| 2024 | -- | $112,640 | $22,200 | $90,440 |
| 2023 | $3,390 | $82,720 | $22,400 | $60,320 |
| 2022 | $3,355 | $82,720 | $22,400 | $60,320 |
| 2021 | $2,854 | $70,720 | $19,600 | $51,120 |
| 2020 | $2,854 | $67,520 | $15,200 | $52,320 |
| 2019 | $2,563 | $62,120 | $15,200 | $46,920 |
| 2018 | $2,561 | $62,120 | $15,200 | $46,920 |
| 2016 | $1,826 | $40,840 | $8,000 | $32,840 |
| 2015 | $1,840 | $40,840 | $8,000 | $32,840 |
| 2014 | $1,496 | $30,960 | $8,000 | $22,960 |
Source: Public Records
Map
Nearby Homes
- 746 Oxford Ct SW
- 717 Oxford Ct SW
- 851 Rockbridge Rd SW
- 881 Rockbridge Rd SW
- 771 Mountainbrooke Cir SW
- 574 Horseshoe Cir SW
- 358 W Wind Dr SW
- 923 Tall Pine Ct SW
- 5221 La Paloma Dr SW Unit 1
- 5774 Vantage Ct
- 1019 Crestwood Ln
- 5104 Onawa Ct SW
- 5521 E Wind Dr SW
- 483 Rollingwood Dr
- 551 Briggs Cir SW
- 228 Amour Way SW
- 507 Castlearie Dr
- 507 Castleaire Dr Unit 1
- 0 Francis Dr SW Unit 7344714
- 0 Francis Dr SW Unit 8519949
- 0 Francis Dr SW Unit 8076644
- 0 Francis Dr SW Unit 3243107
- 0 Francis Dr SW Unit 7621601
- 0 Francis Dr SW Unit 7137819
- 0 Francis Dr SW Unit 7006328
- 5441 Francis Dr SW
- 5451 Francis Dr SW
- 5440 Francis Dr SW
- 5461 Francis Dr SW
- 5436 Francis Dr SW Unit 1
- 710 Jewel Place SW
- 5467 Francis Dr SW Unit 1
- 5421 Francis Dr SW
- 5421 Francis Dr SW Unit 3
- 5477 Francis Dr SW
- 720 Jewel Place SW
- 5481 Francis Dr SW
- 5485 Francis Dr SW