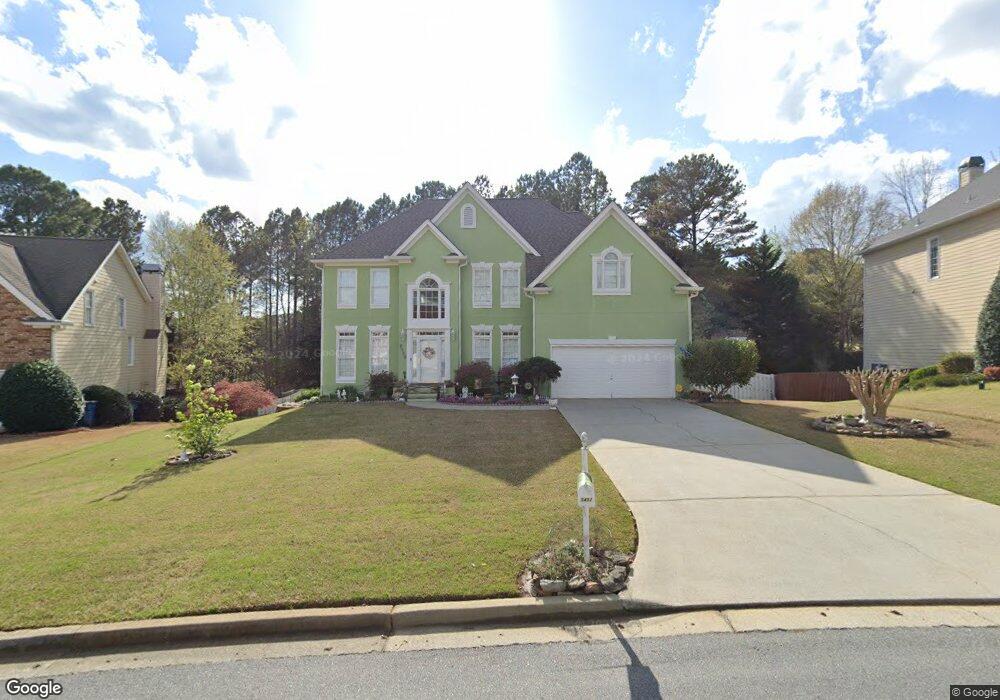
5432 Laurel Ridge Dr Alpharetta, GA 30005
Estimated Value: $635,230 - $704,000
4
Beds
3
Baths
2,811
Sq Ft
$238/Sq Ft
Est. Value
About This Home
This home is located at 5432 Laurel Ridge Dr, Alpharetta, GA 30005 and is currently estimated at $669,808, approximately $238 per square foot. 5432 Laurel Ridge Dr is a home located in Fulton County with nearby schools including Abbotts Hill Elementary School, Taylor Road Middle School, and Chattahoochee High School.
Ownership History
Date
Name
Owned For
Owner Type
Purchase Details
Closed on
Mar 11, 2023
Sold by
Pohl Larry A
Bought by
Larry And Jessie Pohl Liv Tr and Pohl Jessie Kim
Current Estimated Value
Purchase Details
Closed on
Oct 22, 2002
Sold by
Pohl Larry A
Bought by
Pohl Larry A and Pohl Jessie
Home Financials for this Owner
Home Financials are based on the most recent Mortgage that was taken out on this home.
Original Mortgage
$224,000
Interest Rate
5.82%
Mortgage Type
New Conventional
Purchase Details
Closed on
Jul 23, 1997
Sold by
Morrison Homes Of Fla Inc
Bought by
Pohl Larry A
Home Financials for this Owner
Home Financials are based on the most recent Mortgage that was taken out on this home.
Original Mortgage
$214,250
Interest Rate
7.7%
Mortgage Type
New Conventional
Create a Home Valuation Report for This Property
The Home Valuation Report is an in-depth analysis detailing your home's value as well as a comparison with similar homes in the area
Home Values in the Area
Average Home Value in this Area
Purchase History
| Date | Buyer | Sale Price | Title Company |
|---|---|---|---|
| Larry And Jessie Pohl Liv Tr | -- | -- | |
| Pohl Larry A | -- | -- | |
| Pohl Larry A | $238,600 | -- |
Source: Public Records
Mortgage History
| Date | Status | Borrower | Loan Amount |
|---|---|---|---|
| Previous Owner | Pohl Larry A | $224,000 | |
| Previous Owner | Pohl Larry A | $214,250 |
Source: Public Records
Tax History Compared to Growth
Tax History
| Year | Tax Paid | Tax Assessment Tax Assessment Total Assessment is a certain percentage of the fair market value that is determined by local assessors to be the total taxable value of land and additions on the property. | Land | Improvement |
|---|---|---|---|---|
| 2025 | $4,282 | $167,400 | $38,480 | $128,920 |
| 2023 | $4,578 | $162,200 | $38,480 | $123,720 |
| 2022 | $4,977 | $162,200 | $38,480 | $123,720 |
| 2021 | $4,962 | $157,480 | $37,360 | $120,120 |
| 2020 | $4,921 | $152,880 | $51,880 | $101,000 |
| 2019 | $592 | $150,200 | $51,000 | $99,200 |
| 2018 | $4,777 | $146,680 | $49,800 | $96,880 |
| 2017 | $3,566 | $104,760 | $24,600 | $80,160 |
| 2016 | $3,514 | $104,760 | $24,600 | $80,160 |
| 2015 | $3,553 | $104,760 | $24,600 | $80,160 |
| 2014 | $3,695 | $104,760 | $24,600 | $80,160 |
Source: Public Records
Map
Nearby Homes
- 6365 Murets Rd
- 11150 Highfield Chase Dr
- 11260 Donnington Dr
- 1660 Gladewood Dr
- 11125 Linbrook Ln
- 130 Wyndlam Ct
- 335 Dunhill Way Ct
- 11235 Surrey Park Trail
- 5680 Abbotts Bridge Rd
- 5160 Abbotts Bridge Rd
- 5690 Abbotts Bridge Rd
- 5325 Hillgate Crossing
- 5610 N Hillbrooke Trace
- 775 Ellsborough Ct
- 11041 Parsons Rd
- 11619 Davenport Ln
- 11035 Parsons Rd
- 5422 Laurel Ridge Dr
- 5442 Laurel Ridge Dr
- 5412 Laurel Ridge Dr
- 720 Eastbourne Ct
- 5452 Laurel Ridge Dr
- 5443 Laurel Ridge Dr
- 5453 Laurel Ridge Dr
- 730 Eastbourne Ct
- 5402 Laurel Ridge Dr
- 725 Eastbourne Ct
- 5433 Laurel Ridge Dr
- 5463 Laurel Ridge Dr
- 5462 Laurel Ridge Dr
- 5472 Laurel Ridge Dr
- 5423 Laurel Ridge Dr
- 5473 Laurel Ridge Dr
- 715 Eastbourne Ct
- 5482 Laurel Ridge Dr
- 7805 Laurel Crest
- 7813 Laurel Crest