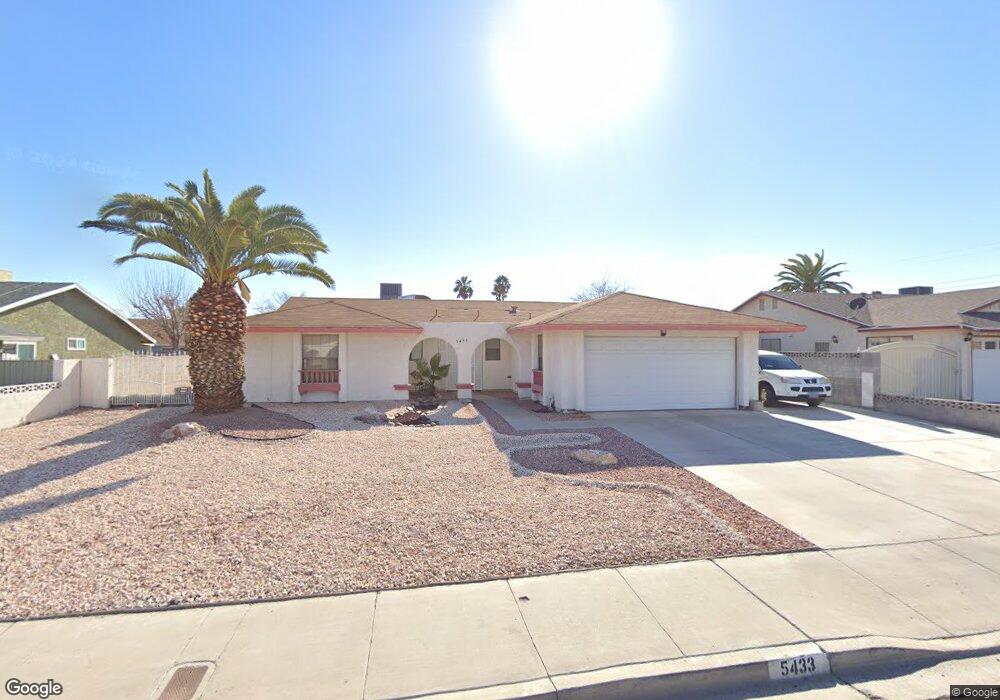
5433 Aston Ave Las Vegas, NV 89142
Estimated Value: $384,037 - $434,000
3
Beds
2
Baths
1,668
Sq Ft
$245/Sq Ft
Est. Value
About This Home
This home is located at 5433 Aston Ave, Las Vegas, NV 89142 and is currently estimated at $409,009, approximately $245 per square foot. 5433 Aston Ave is a home located in Clark County with nearby schools including Cyril Wengert Elementary School, Duane D. Keller Middle School, and Las Vegas High School.
Ownership History
Date
Name
Owned For
Owner Type
Purchase Details
Closed on
Nov 24, 2015
Sold by
Chambers John William and Robinson Chambers Ilima Mc
Bought by
Chambers John William and Ro Mc Ro
Current Estimated Value
Home Financials for this Owner
Home Financials are based on the most recent Mortgage that was taken out on this home.
Original Mortgage
$136,000
Interest Rate
3.83%
Mortgage Type
New Conventional
Purchase Details
Closed on
May 25, 2012
Sold by
William John and Robinson Chambers Ilima Madelaine Carole
Bought by
Chambers Ii John William and Robinson Chambers Ilima Madelaine Carole
Home Financials for this Owner
Home Financials are based on the most recent Mortgage that was taken out on this home.
Original Mortgage
$141,036
Interest Rate
3.86%
Mortgage Type
New Conventional
Create a Home Valuation Report for This Property
The Home Valuation Report is an in-depth analysis detailing your home's value as well as a comparison with similar homes in the area
Home Values in the Area
Average Home Value in this Area
Purchase History
| Date | Buyer | Sale Price | Title Company |
|---|---|---|---|
| Chambers John William | -- | Wfg Lender Services | |
| Chambers Ii John William | -- | Ticor Title Las Vegas |
Source: Public Records
Mortgage History
| Date | Status | Borrower | Loan Amount |
|---|---|---|---|
| Closed | Chambers John William | $136,000 | |
| Closed | Chambers Ii John William | $141,036 |
Source: Public Records
Tax History Compared to Growth
Tax History
| Year | Tax Paid | Tax Assessment Tax Assessment Total Assessment is a certain percentage of the fair market value that is determined by local assessors to be the total taxable value of land and additions on the property. | Land | Improvement |
|---|---|---|---|---|
| 2025 | $1,020 | $58,794 | $28,700 | $30,094 |
| 2024 | $991 | $58,794 | $28,700 | $30,094 |
| 2023 | $808 | $61,386 | $31,500 | $29,886 |
| 2022 | $962 | $55,860 | $28,000 | $27,860 |
| 2021 | $934 | $51,837 | $24,850 | $26,987 |
| 2020 | $904 | $52,147 | $24,850 | $27,297 |
| 2019 | $878 | $46,540 | $19,250 | $27,290 |
| 2018 | $852 | $45,935 | $19,250 | $26,685 |
| 2017 | $1,277 | $43,544 | $16,100 | $27,444 |
| 2016 | $808 | $40,880 | $12,600 | $28,280 |
| 2015 | $805 | $38,120 | $9,800 | $28,320 |
| 2014 | $782 | $35,726 | $7,000 | $28,726 |
Source: Public Records
Map
Nearby Homes
- 1950 Abarth St
- 1919 Niblick Cir
- 5539 Ballinger Dr
- 5406 Silverheart Ave
- 2306 Abarth St
- 1745 Starridge Way
- 1721 Starridge Way
- 2058 Citroen St
- 1728 S Christy Ln
- 1718 S Christy Ln
- 1841 Skywood Way
- 1871 Cobra Ct
- 2454 Winterwood Blvd
- 2450 Tournament St
- 2369 Citroen St
- 2484 Anglia St
- 2229 Bowstring Dr
- 5634 Alcott Ave
- 2508 Alfa Cir
- 1836 Winterwood Blvd
- 5421 Aston Ave
- 5445 Aston Ave
- 5434 Cleek St
- 5434 Cleek St Unit : 161-04-712-034
- 5422 Cleek St
- 5446 Cleek St
- 5440 Aston Ave
- 5432 Aston Ave
- 5409 Aston Ave
- 5410 Cleek St
- 5460 Cleek St
- 5450 Aston Ave
- 1933 Niblick Cir
- 1970 Abarth St Unit 32
- 1908 Niblick Cir
- 5433 Cleek St
- 1994 Abarth St
- 5445 Cleek St
- 5459 Cleek St
- 5391 Aston Ave