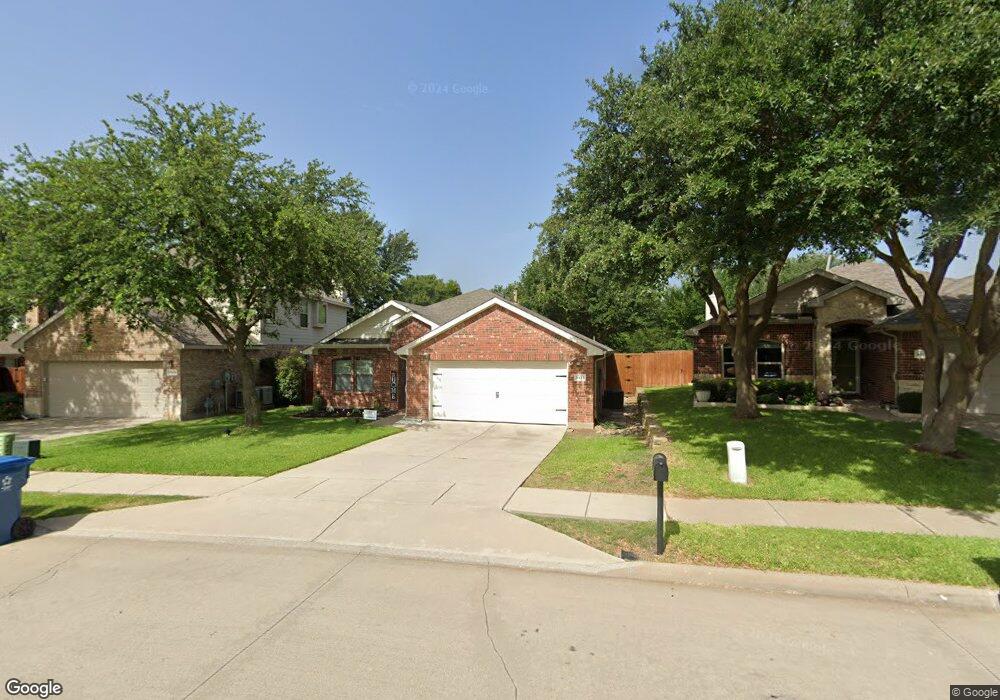
5433 Barkridge Trail Flower Mound, TX 75028
Prairie Creek NeighborhoodEstimated Value: $418,000 - $437,000
3
Beds
2
Baths
1,797
Sq Ft
$236/Sq Ft
Est. Value
About This Home
This home is located at 5433 Barkridge Trail, Flower Mound, TX 75028 and is currently estimated at $424,327, approximately $236 per square foot. 5433 Barkridge Trail is a home located in Denton County with nearby schools including Prairie Trail Elementary School, Lamar Middle School, and Marcus High School.
Ownership History
Date
Name
Owned For
Owner Type
Purchase Details
Closed on
Jul 12, 2019
Sold by
Zondor Kimberly and Kimberly Zondor Living Trust
Bought by
Ross Amber Nicole and Ross Christian Joseph Franklin
Current Estimated Value
Home Financials for this Owner
Home Financials are based on the most recent Mortgage that was taken out on this home.
Original Mortgage
$216,000
Outstanding Balance
$189,546
Interest Rate
3.9%
Mortgage Type
New Conventional
Estimated Equity
$234,781
Purchase Details
Closed on
Jul 12, 2011
Sold by
Zondor Kimberly
Bought by
Zondor Kimberly
Purchase Details
Closed on
Jan 14, 2011
Sold by
Zondor Kimberly
Bought by
Zondor Kimberly
Purchase Details
Closed on
May 25, 2005
Sold by
Cedar Creek Development Llc
Bought by
Zondor David W and Zondor Kimberly J
Home Financials for this Owner
Home Financials are based on the most recent Mortgage that was taken out on this home.
Original Mortgage
$145,133
Interest Rate
5.83%
Mortgage Type
Fannie Mae Freddie Mac
Create a Home Valuation Report for This Property
The Home Valuation Report is an in-depth analysis detailing your home's value as well as a comparison with similar homes in the area
Home Values in the Area
Average Home Value in this Area
Purchase History
| Date | Buyer | Sale Price | Title Company |
|---|---|---|---|
| Ross Amber Nicole | -- | Allegiance Title | |
| Zondor Kimberly | -- | None Available | |
| Zondor Kimberly | -- | None Available | |
| Zondor David W | -- | Fatco |
Source: Public Records
Mortgage History
| Date | Status | Borrower | Loan Amount |
|---|---|---|---|
| Open | Ross Amber Nicole | $216,000 | |
| Previous Owner | Zondor David W | $145,133 | |
| Closed | Zondor David W | $27,212 |
Source: Public Records
Tax History Compared to Growth
Tax History
| Year | Tax Paid | Tax Assessment Tax Assessment Total Assessment is a certain percentage of the fair market value that is determined by local assessors to be the total taxable value of land and additions on the property. | Land | Improvement |
|---|---|---|---|---|
| 2025 | $5,284 | $414,000 | $161,846 | $252,154 |
| 2024 | $6,643 | $392,376 | $0 | $0 |
| 2023 | $4,732 | $356,705 | $137,741 | $310,317 |
| 2022 | $6,029 | $324,277 | $108,815 | $291,445 |
| 2021 | $5,922 | $307,298 | $68,871 | $238,427 |
| 2020 | $5,358 | $267,997 | $68,871 | $199,126 |
| 2019 | $5,462 | $263,609 | $68,871 | $194,738 |
| 2018 | $5,181 | $248,588 | $68,871 | $179,717 |
| 2017 | $5,079 | $241,000 | $68,871 | $172,129 |
| 2016 | $5,023 | $211,052 | $50,425 | $160,627 |
| 2015 | $4,240 | $200,541 | $50,425 | $150,116 |
| 2013 | -- | $180,233 | $50,425 | $129,808 |
Source: Public Records
Map
Nearby Homes
- 5400 Carriage Ct
- 5329 Ponder Place
- 1682 Shannon Dr
- 1208 Homestead St
- 1617 Oak Creek Dr
- 1661 Crosshaven Dr
- 1602 Autumn Breeze Ln
- 1613 Autumn Breeze Ln
- 1554 N Valley Pkwy
- 1601 Autumn Breeze Ln
- 5309 Buckner Dr
- 1581 Glenmore Dr
- 1105 Coker Dr
- 1685 Niagara Blvd
- 1529 Springaire Ln
- 1534 Autumn Breeze Ln
- 4925 Marcus Dr
- 1681 Yellowstone Ave
- 1204 Marcus Ct
- 5324 Peterson Ct
- 5501 Barkridge Trail
- 5425 Barkridge Trail
- 5505 Barkridge Trail
- 5421 Barkridge Trail
- 5500 Barkridge Trail
- 5504 Barkridge Trail
- 5416 Park Place
- 5412 Park Place
- 5417 Barkridge Trail
- 1229 Maddy Ln
- 5413 Park Place
- 5408 Park Place
- 5413 Barkridge Trail
- 1225 Maddy Ln
- 1212 Maddy Ln
- 1251 Sunlight Dr
- 1200 Shamrock Dr
- 5409 Barkridge Trail
- 1301 Sunlight Dr
- 1221 Maddy Ln