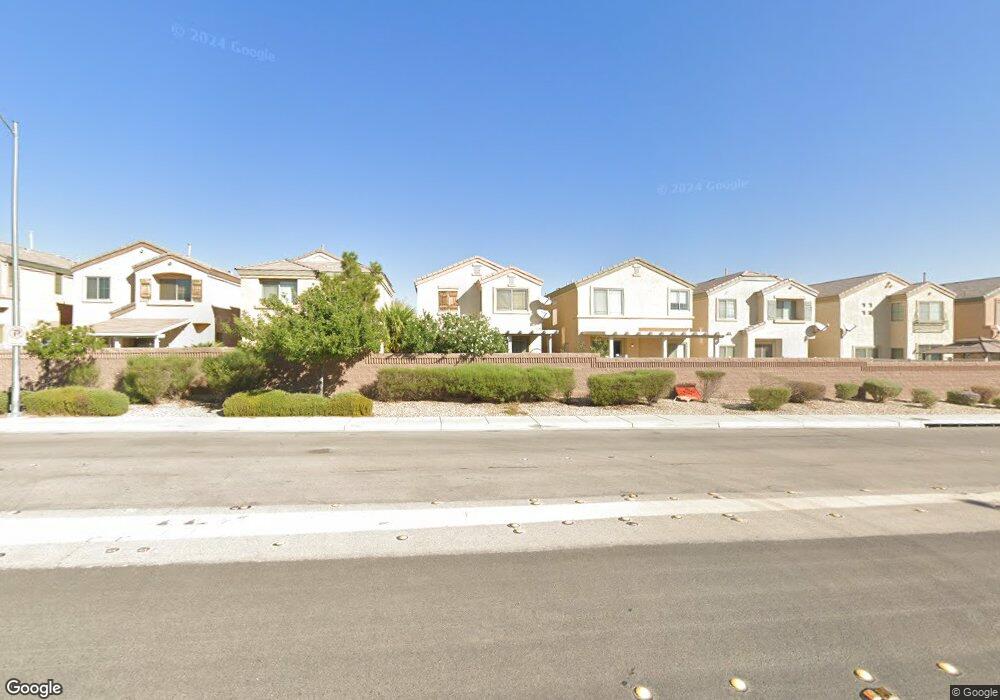
5433 Tinker Toy Ave Las Vegas, NV 89139
Coronado Ranch NeighborhoodEstimated Value: $402,000 - $419,000
3
Beds
3
Baths
1,649
Sq Ft
$249/Sq Ft
Est. Value
About This Home
This home is located at 5433 Tinker Toy Ave, Las Vegas, NV 89139 and is currently estimated at $411,105, approximately $249 per square foot. 5433 Tinker Toy Ave is a home located in Clark County with nearby schools including Dr. Beverly S. Mathis Elementary School, Lawrence & Heidi Canarelli Middle School, and Desert Oasis High School.
Ownership History
Date
Name
Owned For
Owner Type
Purchase Details
Closed on
May 13, 2021
Sold by
Alcaraz Gabriel T and Alcaraz Lilia
Bought by
Alcaraz Gabriel T
Current Estimated Value
Home Financials for this Owner
Home Financials are based on the most recent Mortgage that was taken out on this home.
Original Mortgage
$156,000
Outstanding Balance
$141,375
Interest Rate
3.1%
Mortgage Type
New Conventional
Estimated Equity
$269,730
Purchase Details
Closed on
Jan 17, 2020
Sold by
Alcaraz Gabriel T
Bought by
Alcaraz Gabriel T and Alcaraz Lilia
Purchase Details
Closed on
Jan 15, 2007
Sold by
Centex Homes
Bought by
Alcaraz Gabriel T
Home Financials for this Owner
Home Financials are based on the most recent Mortgage that was taken out on this home.
Original Mortgage
$255,450
Interest Rate
6.25%
Mortgage Type
Unknown
Create a Home Valuation Report for This Property
The Home Valuation Report is an in-depth analysis detailing your home's value as well as a comparison with similar homes in the area
Home Values in the Area
Average Home Value in this Area
Purchase History
| Date | Buyer | Sale Price | Title Company |
|---|---|---|---|
| Alcaraz Gabriel T | -- | Fidelity National Title | |
| Alcaraz Gabriel T | -- | Fidelity National Title | |
| Alcaraz Gabriel T | -- | None Available | |
| Alcaraz Gabriel T | $319,364 | Commerce Title |
Source: Public Records
Mortgage History
| Date | Status | Borrower | Loan Amount |
|---|---|---|---|
| Open | Alcaraz Gabriel T | $156,000 | |
| Closed | Alcaraz Gabriel T | $255,450 |
Source: Public Records
Tax History Compared to Growth
Tax History
| Year | Tax Paid | Tax Assessment Tax Assessment Total Assessment is a certain percentage of the fair market value that is determined by local assessors to be the total taxable value of land and additions on the property. | Land | Improvement |
|---|---|---|---|---|
| 2025 | $1,711 | $107,045 | $31,500 | $75,545 |
| 2024 | $1,662 | $107,045 | $31,500 | $75,545 |
| 2023 | $1,317 | $100,851 | $29,750 | $71,101 |
| 2022 | $1,769 | $88,973 | $24,150 | $64,823 |
| 2021 | $1,638 | $84,634 | $23,100 | $61,534 |
| 2020 | $1,518 | $82,888 | $22,050 | $60,838 |
| 2019 | $1,474 | $79,010 | $19,250 | $59,760 |
| 2018 | $1,406 | $71,840 | $14,700 | $57,140 |
| 2017 | $2,115 | $72,125 | $14,350 | $57,775 |
| 2016 | $1,317 | $65,451 | $10,500 | $54,951 |
| 2015 | $1,314 | $59,241 | $9,800 | $49,441 |
| 2014 | $1,276 | $42,195 | $4,550 | $37,645 |
Source: Public Records
Map
Nearby Homes
- 5419 Floating Flower Ave
- 5390 Montauck Ave
- 5481 Railroad River Ave
- 7569 Garden Galley St
- 7825 Bright Lodge St
- 7881 Tyrell Peaks St
- 7766 Pacific Dunes St
- 5597 Fewkes Canyon Ct
- 7813 Westwind Rd
- 5431 Hasley Canyon Ave
- 7432 Decoro St
- 7418 Granada Willows St
- 7445 Innovation Peak Ct
- 7415 Innovation Peak Ct
- 4998 Lavaliere Ave
- 7724 Somerhill Point Way
- 7468 Treasure Chest St
- 7923 Homer Ct
- 7819 Harp Tree St
- 5093 Tioga Pass Ave
- 5441 Tinker Toy Ave
- 5425 Tinker Toy Ave
- 5449 Tinker Toy Ave
- 5417 Tinker Toy Ave
- 5457 Tinker Toy Ave
- 5409 Tinker Toy Ave
- 5465 Tinker Toy Ave
- 5436 Tinker Toy Ave
- 5401 Tinker Toy Ave
- 5428 Tinker Toy Ave
- 5444 Tinker Toy Ave
- 5444 Tinker Toy Ave Unit n/a
- 5473 Tinker Toy Ave
- 5393 Tinker Toy Ave
- 5460 Tinker Toy Ave
- 5404 Tinker Toy Ave
- 5468 Tinker Toy Ave
- 5479 Tinker Toy Ave
- 5385 Tinker Toy Ave