5434 Akron St Philadelphia, PA 19124
Frankford NeighborhoodEstimated Value: $188,639 - $226,000
3
Beds
1
Bath
1,302
Sq Ft
$162/Sq Ft
Est. Value
About This Home
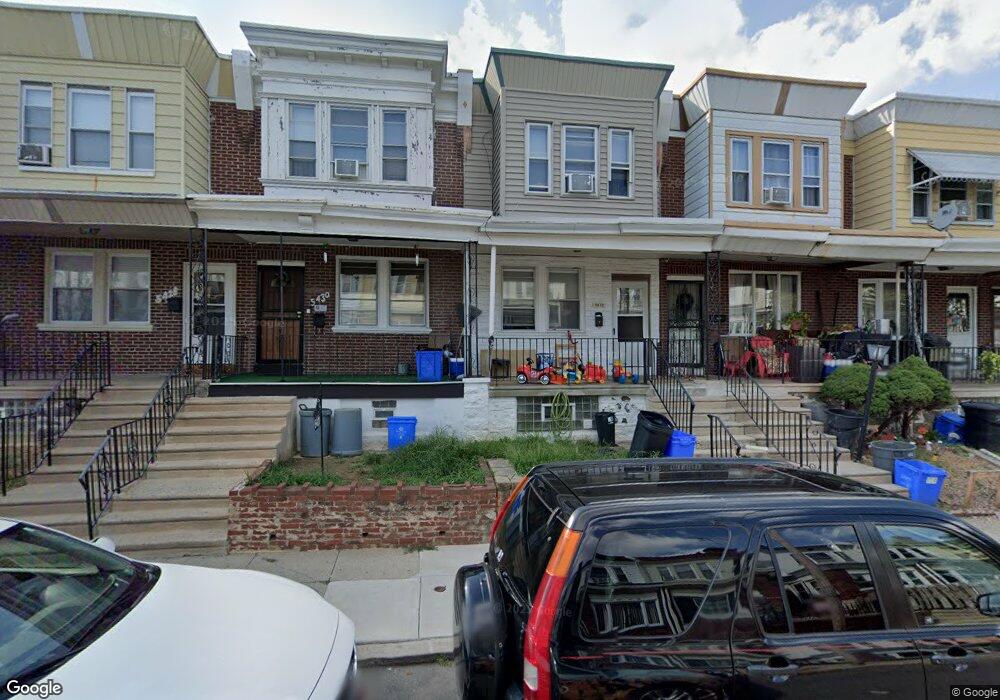
This home is located at 5434 Akron St, Philadelphia, PA 19124 and is currently estimated at $211,160, approximately $162 per square foot. 5434 Akron St is a home located in Philadelphia County with nearby schools including Frankford High School, The Philadelphia Charter School for the Arts & Sciences, and Mastery Schools Smedley Elementary.
Ownership History
Date
Name
Owned For
Owner Type
Purchase Details
Closed on
Aug 18, 2000
Sold by
Callahan Frank A and Callahan Patricia
Bought by
Fobbs Corbin and Fobbs Erica N
Current Estimated Value
Home Financials for this Owner
Home Financials are based on the most recent Mortgage that was taken out on this home.
Original Mortgage
$50,971
Outstanding Balance
$17,942
Interest Rate
8%
Mortgage Type
FHA
Estimated Equity
$193,218
Create a Home Valuation Report for This Property
The Home Valuation Report is an in-depth analysis detailing your home's value as well as a comparison with similar homes in the area
Home Values in the Area
Average Home Value in this Area
Purchase History
| Date | Buyer | Sale Price | Title Company |
|---|---|---|---|
| Fobbs Corbin | $51,000 | Security Search & Abstract C |
Source: Public Records
Mortgage History
| Date | Status | Borrower | Loan Amount |
|---|---|---|---|
| Open | Fobbs Corbin | $50,971 |
Source: Public Records
Tax History Compared to Growth
Tax History
| Year | Tax Paid | Tax Assessment Tax Assessment Total Assessment is a certain percentage of the fair market value that is determined by local assessors to be the total taxable value of land and additions on the property. | Land | Improvement |
|---|---|---|---|---|
| 2026 | $1,698 | $170,400 | $34,080 | $136,320 |
| 2025 | $1,698 | $170,400 | $34,080 | $136,320 |
| 2024 | $1,698 | $170,400 | $34,080 | $136,320 |
| 2023 | $1,698 | $121,300 | $24,200 | $97,100 |
| 2022 | $615 | $76,300 | $24,200 | $52,100 |
| 2021 | $1,244 | $0 | $0 | $0 |
| 2020 | $1,244 | $0 | $0 | $0 |
| 2019 | $1,194 | $0 | $0 | $0 |
| 2018 | $767 | $0 | $0 | $0 |
| 2017 | $1,187 | $0 | $0 | $0 |
| 2016 | $767 | $0 | $0 | $0 |
| 2015 | $734 | $0 | $0 | $0 |
| 2014 | -- | $84,800 | $14,947 | $69,853 |
| 2012 | -- | $11,520 | $952 | $10,568 |
Source: Public Records
Map
Nearby Homes