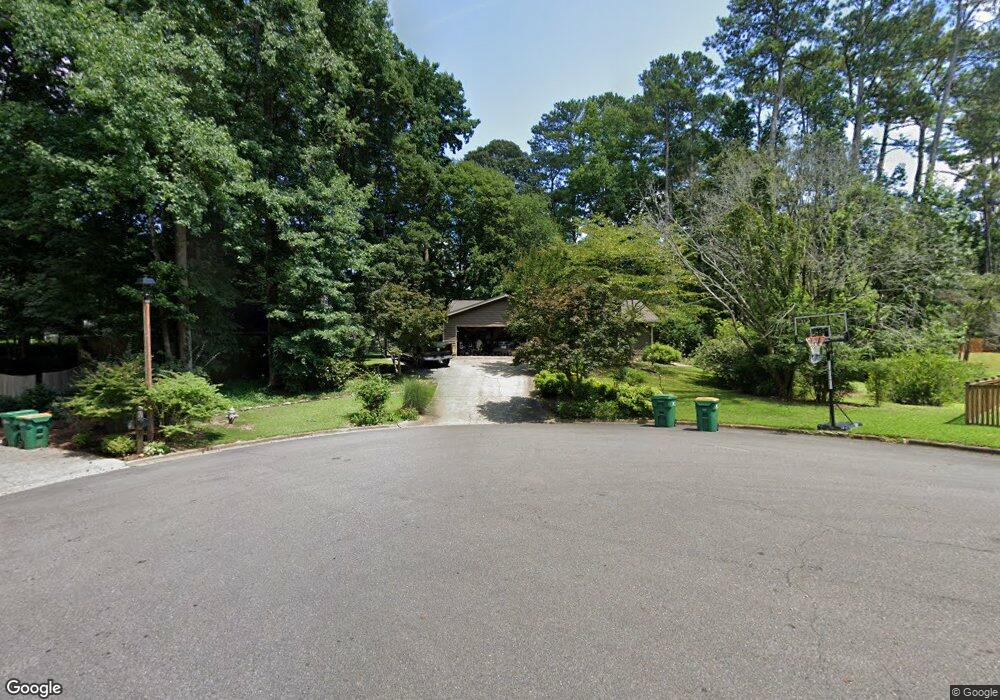
5434 Springfield Ct Unit 1 Norcross, GA 30092
Estimated Value: $493,000 - $518,000
4
Beds
2
Baths
1,676
Sq Ft
$298/Sq Ft
Est. Value
About This Home
This home is located at 5434 Springfield Ct Unit 1, Norcross, GA 30092 and is currently estimated at $499,853, approximately $298 per square foot. 5434 Springfield Ct Unit 1 is a home located in Gwinnett County with nearby schools including Simpson Elementary School, Pinckneyville Middle School, and Norcross High School.
Ownership History
Date
Name
Owned For
Owner Type
Purchase Details
Closed on
Mar 13, 2025
Sold by
Sinclair Eric T
Bought by
Gardini Laura M Tr and Sinclair Eric T Tr
Current Estimated Value
Purchase Details
Closed on
May 23, 2002
Sold by
Florio Stephen G
Bought by
Sinclair Eric T
Home Financials for this Owner
Home Financials are based on the most recent Mortgage that was taken out on this home.
Original Mortgage
$131,400
Interest Rate
7.5%
Mortgage Type
New Conventional
Purchase Details
Closed on
Aug 15, 1996
Sold by
Mcadoo Martha V
Bought by
Florid Stephen G Anabel
Purchase Details
Closed on
May 21, 1996
Sold by
Bollweg Robert Sharon M
Bought by
Mcadoo Martha V
Create a Home Valuation Report for This Property
The Home Valuation Report is an in-depth analysis detailing your home's value as well as a comparison with similar homes in the area
Home Values in the Area
Average Home Value in this Area
Purchase History
| Date | Buyer | Sale Price | Title Company |
|---|---|---|---|
| Gardini Laura M Tr | -- | -- | |
| Sinclair Eric T | $175,300 | -- | |
| Florid Stephen G Anabel | $128,000 | -- | |
| Mcadoo Martha V | $128,000 | -- |
Source: Public Records
Mortgage History
| Date | Status | Borrower | Loan Amount |
|---|---|---|---|
| Previous Owner | Sinclair Eric T | $131,400 | |
| Closed | Mcadoo Martha V | $0 |
Source: Public Records
Tax History Compared to Growth
Tax History
| Year | Tax Paid | Tax Assessment Tax Assessment Total Assessment is a certain percentage of the fair market value that is determined by local assessors to be the total taxable value of land and additions on the property. | Land | Improvement |
|---|---|---|---|---|
| 2025 | -- | $149,760 | $31,920 | $117,840 |
| 2024 | -- | $162,600 | $40,000 | $122,600 |
| 2023 | $4,508 | $153,480 | $36,400 | $117,080 |
| 2022 | $4,617 | $135,400 | $32,800 | $102,600 |
| 2021 | $4,578 | $119,240 | $26,240 | $93,000 |
| 2020 | $4,469 | $115,520 | $26,000 | $89,520 |
| 2019 | $4,303 | $115,520 | $26,000 | $89,520 |
| 2018 | $3,960 | $105,320 | $24,000 | $81,320 |
| 2016 | $3,140 | $82,880 | $24,000 | $58,880 |
| 2015 | $3,153 | $82,880 | $24,000 | $58,880 |
| 2014 | -- | $80,240 | $24,000 | $56,240 |
Source: Public Records
Map
Nearby Homes
- 5397 Valley Mist Ct
- 4531 Outer Bank Dr
- 5465 Fort Fisher Way
- 5465 Fort Fisher Way
- 5545 Fitzpatrick Terrace
- 5221 W Jones Bridge Rd
- 5350 Wickershire Dr
- 5354 Fox Hill Dr
- 4916 Sudbrook Way Unit 253
- The Adams Plan at Waterside - Condos
- 4457 Watervale Way Unit 292
- 4477 Watervale Way Unit 286
- 5047 Shirley Oaks Dr Unit 313
- 4903 Sudbrook Way Unit 239
- The Olmstead II Plan at Waterside - Plaza
- The Stanley Plan at Waterside - Single Family
- The Stafford Plan at Waterside - Single Family
- 5039 Shirley Oaks Dr Unit 315
- 4479 Watervale Way Unit 285
- 5059 Shirley Oaks Dr Unit 309
- 4449 Parkspring Terrace Unit 1
- 4459 Parkspring Terrace Unit 1
- 5454 Springfield Ct
- 4416 Springfield Dr
- 4436 Springfield Dr
- 5433 Springfield Ct
- 4439 Parkspring Terrace
- 0 Springfield Ct Unit 7087813
- 5443 Springfield Ct
- 4469 Parkspring Terrace
- 5453 Springfield Ct
- 0 Parkspring Terrace NW Unit 7486952
- 0 Parkspring Terrace NW Unit 8446502
- 4456 Springfield Dr
- 4478 Parkspring Terrace Unit 1
- 0 Jones Bridge Cir Unit 7462584
- 0 Jones Bridge Cir Unit 7372966
- 0 Jones Bridge Cir Unit 7279404
- 0 Jones Bridge Cir Unit 7040649
- 0 Jones Bridge Cir Unit 3266894