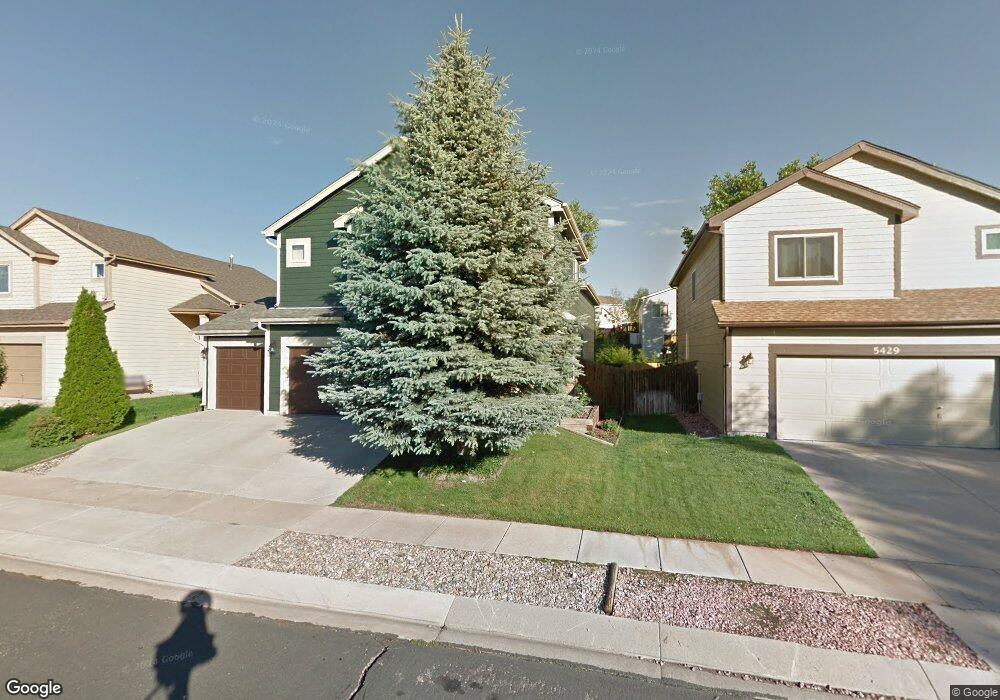
5435 Blackcloud Loop Colorado Springs, CO 80922
Stetson Hills NeighborhoodEstimated Value: $453,000 - $494,000
4
Beds
3
Baths
2,170
Sq Ft
$216/Sq Ft
Est. Value
About This Home
This home is located at 5435 Blackcloud Loop, Colorado Springs, CO 80922 and is currently estimated at $469,534, approximately $216 per square foot. 5435 Blackcloud Loop is a home located in El Paso County with nearby schools including Odyssey Elementary School, Skyview Middle School, and Vista Ridge High School.
Ownership History
Date
Name
Owned For
Owner Type
Purchase Details
Closed on
Mar 7, 2001
Sold by
Faria Antonio and Faria Maria N
Bought by
Faria Paul J and Faria Tracey L
Current Estimated Value
Home Financials for this Owner
Home Financials are based on the most recent Mortgage that was taken out on this home.
Original Mortgage
$150,600
Outstanding Balance
$55,166
Interest Rate
7.1%
Estimated Equity
$414,368
Purchase Details
Closed on
Apr 9, 1999
Sold by
Antonio Faria and Antonio Maria N
Bought by
Faria Antonio and Faria Maria N
Purchase Details
Closed on
Dec 3, 1997
Sold by
U S Home Corp
Bought by
Faria Antonio and Faria Maria N
Home Financials for this Owner
Home Financials are based on the most recent Mortgage that was taken out on this home.
Original Mortgage
$144,600
Interest Rate
9.87%
Create a Home Valuation Report for This Property
The Home Valuation Report is an in-depth analysis detailing your home's value as well as a comparison with similar homes in the area
Home Values in the Area
Average Home Value in this Area
Purchase History
| Date | Buyer | Sale Price | Title Company |
|---|---|---|---|
| Faria Paul J | -- | Title America | |
| Faria Antonio | -- | -- | |
| Faria Antonio | $160,675 | Stewart Title |
Source: Public Records
Mortgage History
| Date | Status | Borrower | Loan Amount |
|---|---|---|---|
| Open | Faria Paul J | $150,600 | |
| Closed | Faria Antonio | $144,600 |
Source: Public Records
Tax History Compared to Growth
Tax History
| Year | Tax Paid | Tax Assessment Tax Assessment Total Assessment is a certain percentage of the fair market value that is determined by local assessors to be the total taxable value of land and additions on the property. | Land | Improvement |
|---|---|---|---|---|
| 2025 | $1,833 | $32,840 | -- | -- |
| 2024 | $1,733 | $32,800 | $4,620 | $28,180 |
| 2023 | $1,733 | $32,800 | $4,620 | $28,180 |
| 2022 | $1,495 | $24,050 | $4,170 | $19,880 |
| 2021 | $1,557 | $24,750 | $4,290 | $20,460 |
| 2020 | $1,343 | $21,100 | $3,580 | $17,520 |
| 2019 | $1,329 | $21,100 | $3,580 | $17,520 |
| 2018 | $1,165 | $18,150 | $3,020 | $15,130 |
| 2017 | $1,171 | $18,150 | $3,020 | $15,130 |
| 2016 | $1,235 | $18,890 | $2,950 | $15,940 |
| 2015 | $1,236 | $18,890 | $2,950 | $15,940 |
| 2014 | $1,013 | $15,190 | $2,790 | $12,400 |
Source: Public Records
Map
Nearby Homes
- 6315 Basalt Ct
- 5209 Palomino Ranch Point
- 5137 Palomino Ranch Point
- 5169 Palomino Ranch Point
- 5234 Ferrari Dr
- 6350 Naturita Trail
- 5312 Ferrari Dr
- 5053 Blackcloud Loop
- 4801 Sweetgrass Ln
- 5057 Sweetgrass Ln
- 4855 Bittercreek Dr
- 5618 Tomiche Dr
- 5935 Faxon Ct
- 6125 Lowlander Ct
- 6170 Katy Ct
- 5639 Mesa Mountain Way
- 4790 Findon Place
- 4690 Badlands Ct
- 6180 Kettle Ct
- 4886 Sweetgrass Ln
- 5429 Blackcloud Loop
- 5441 Blackcloud Loop
- 5423 Blackcloud Loop
- 5447 Blackcloud Loop
- 5333 Danville Ct
- 5343 Danville Ct
- 5323 Danville Ct
- 6210 Silverado Trail
- 5353 Danville Ct
- 5313 Danville Ct
- 5417 Blackcloud Loop
- 5453 Blackcloud Loop
- 5434 Blackcloud Loop
- 6220 Silverado Trail
- 5430 Blackcloud Loop
- 5303 Danville Ct
- 6215 Silverado Trail
- 5363 Danville Ct
- 5411 Blackcloud Loop
- 6230 Silverado Trail