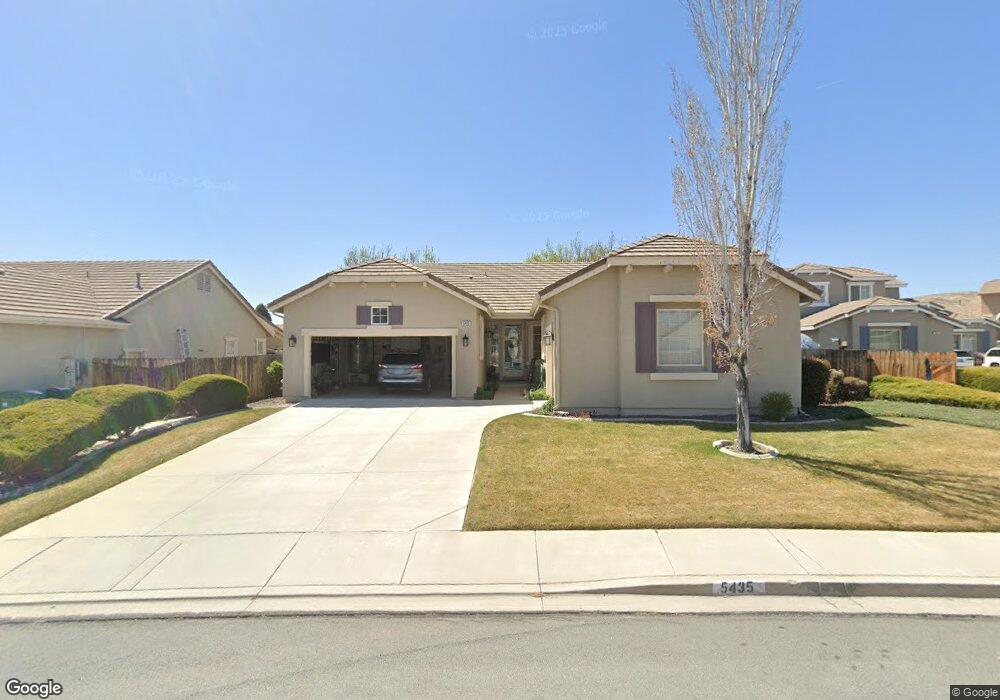
5435 Junction Peak Dr Unit 3 Sparks, NV 89436
Sparks Galleria NeighborhoodEstimated Value: $549,000 - $559,667
3
Beds
2
Baths
1,853
Sq Ft
$300/Sq Ft
Est. Value
About This Home
This home is located at 5435 Junction Peak Dr Unit 3, Sparks, NV 89436 and is currently estimated at $556,167, approximately $300 per square foot. 5435 Junction Peak Dr Unit 3 is a home located in Washoe County with nearby schools including Miguel Sepulveda Elementary School, Sky Ranch Middle School, and Edward C Reed High School.
Ownership History
Date
Name
Owned For
Owner Type
Purchase Details
Closed on
Nov 23, 2020
Sold by
Brown Richard L and Brown Mary Ann
Bought by
Brown Mary Ann C and Brown Richard L
Current Estimated Value
Home Financials for this Owner
Home Financials are based on the most recent Mortgage that was taken out on this home.
Original Mortgage
$90,000
Interest Rate
2.8%
Mortgage Type
New Conventional
Purchase Details
Closed on
Jun 25, 2004
Sold by
R & K Homes Kiley Ranch Ii Llc
Bought by
Brown Richard L and Brown Mary Ann C
Home Financials for this Owner
Home Financials are based on the most recent Mortgage that was taken out on this home.
Original Mortgage
$132,000
Interest Rate
6.27%
Mortgage Type
Unknown
Create a Home Valuation Report for This Property
The Home Valuation Report is an in-depth analysis detailing your home's value as well as a comparison with similar homes in the area
Home Values in the Area
Average Home Value in this Area
Purchase History
| Date | Buyer | Sale Price | Title Company |
|---|---|---|---|
| Brown Mary Ann C | -- | First Centennial Reno | |
| Brown Richard L | $266,000 | First American Title |
Source: Public Records
Mortgage History
| Date | Status | Borrower | Loan Amount |
|---|---|---|---|
| Previous Owner | Brown Mary Ann C | $90,000 | |
| Previous Owner | Brown Richard L | $132,000 |
Source: Public Records
Tax History Compared to Growth
Tax History
| Year | Tax Paid | Tax Assessment Tax Assessment Total Assessment is a certain percentage of the fair market value that is determined by local assessors to be the total taxable value of land and additions on the property. | Land | Improvement |
|---|---|---|---|---|
| 2025 | $2,755 | $137,122 | $38,465 | $98,657 |
| 2024 | $2,672 | $133,186 | $33,950 | $99,236 |
| 2023 | $2,672 | $132,666 | $38,780 | $93,886 |
| 2022 | $2,597 | $107,261 | $29,155 | $78,106 |
| 2021 | $2,413 | $102,663 | $25,025 | $77,638 |
| 2020 | $2,340 | $102,386 | $24,675 | $77,711 |
| 2019 | $2,271 | $98,707 | $23,940 | $74,767 |
| 2018 | $2,206 | $91,401 | $18,270 | $73,131 |
| 2017 | $2,142 | $90,875 | $17,710 | $73,165 |
| 2016 | $2,086 | $89,301 | $15,505 | $73,796 |
| 2015 | $526 | $86,960 | $13,545 | $73,415 |
| 2014 | $2,022 | $76,613 | $12,740 | $63,873 |
| 2013 | -- | $56,562 | $9,415 | $47,147 |
Source: Public Records
Map
Nearby Homes
- 5365 Ebbetts Pass Dr
- 601 W Equinox Peak Ct
- 601 W Equinox Peak Ct Unit Homesite 2030
- 811 Pinchot Pass Ct Unit 5
- 801 Pinchot Pass Ct Unit 7
- 6835 Summit View Dr
- 2084 Great Bluffs Ln Unit Homesite 5132
- 2094 Great Bluffs Ln Unit Homesite 5133
- 7129 Singing Tree Rd Unit Homesite 5121
- 6920 Pah Rah Dr
- 6671 April St
- 6835 Pah Rah Dr
- 5651 Hunting Creek Way
- 5725 Crooked Stick Way
- 6560 Pyramid Way Unit 52
- 5049 Keams Ct
- 585 Sonora Pass Ct
- 6550 Pyramid Way Unit 61
- 4956 Monrovia Dr
- 6690 Dorchester Dr
- 5425 Junction Peak Dr Unit 3
- 5455 Junction Peak Dr
- 810 Sequoia Pass Ct
- 5415 Junction Peak Dr
- 820 Sequoia Pass Ct
- 5444 Junction Peak Dr
- 5475 Junction Peak Dr
- 5424 Junction Peak Dr Unit 3
- 800 Sequoia Pass Ct
- 5488 Junction Peak Dr
- 5495 Junction Peak Dr
- 830 Sequoia Pass Ct
- 5405 Junction Peak Dr
- 5414 Junction Peak Dr Unit 3
- 5424 Ebbetts Pass Dr Unit 7
- 5404 Ebbetts Pass Dr Unit 7
- 5444 Ebbetts Pass Dr Unit 3
- 5398 Ebbetts Pass Dr Unit 7
- 5508 Junction Peak Dr
- 845 Luther Pass Ct