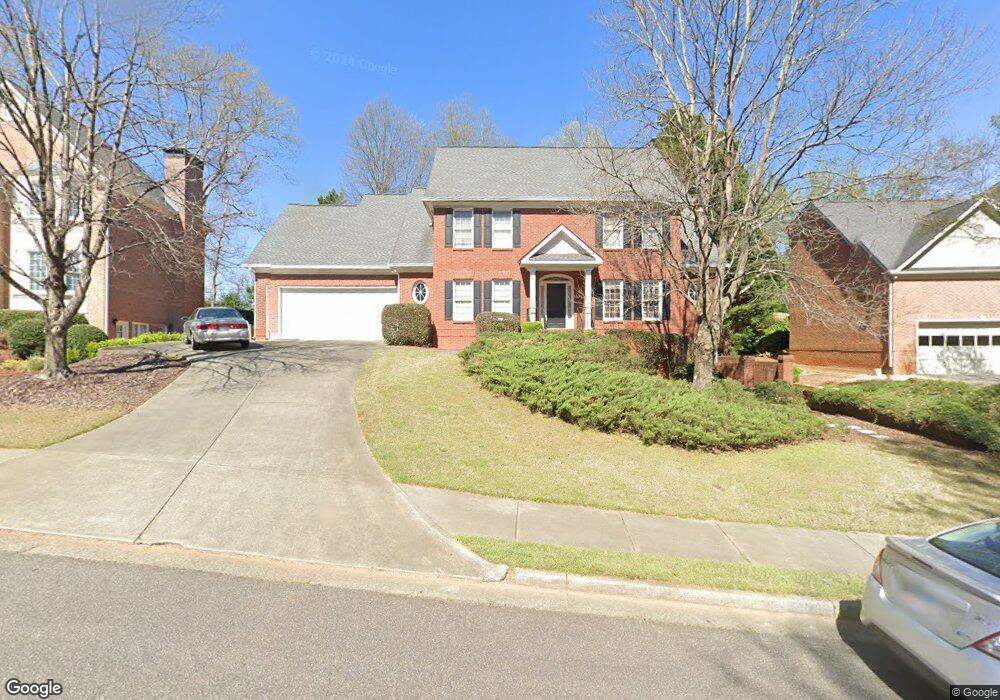
5435 Preserve Cir Unit 3B Alpharetta, GA 30005
Seven Oaks NeighborhoodEstimated Value: $837,332 - $887,000
4
Beds
3
Baths
3,334
Sq Ft
$259/Sq Ft
Est. Value
About This Home
This home is located at 5435 Preserve Cir Unit 3B, Alpharetta, GA 30005 and is currently estimated at $862,833, approximately $258 per square foot. 5435 Preserve Cir Unit 3B is a home located in Fulton County with nearby schools including River Trail Middle School, Northview High School, and McGinnis Woods School.
Ownership History
Date
Name
Owned For
Owner Type
Purchase Details
Closed on
Apr 27, 1999
Sold by
Kazemi and Kazemi Asfeh Mohammah
Bought by
Kazemi and Kazemi Asfeh Mohammad
Current Estimated Value
Home Financials for this Owner
Home Financials are based on the most recent Mortgage that was taken out on this home.
Original Mortgage
$192,000
Interest Rate
7.06%
Mortgage Type
New Conventional
Purchase Details
Closed on
Apr 23, 1999
Sold by
Huber Mark J and Huber Sarah H
Bought by
Kazemi and Kazemi Asfeh Mohammad
Home Financials for this Owner
Home Financials are based on the most recent Mortgage that was taken out on this home.
Original Mortgage
$192,000
Interest Rate
7.06%
Mortgage Type
New Conventional
Purchase Details
Closed on
Apr 30, 1998
Sold by
Finn Larry and Finn Rosie C
Bought by
Huber Mark J and Huber Sarah H
Home Financials for this Owner
Home Financials are based on the most recent Mortgage that was taken out on this home.
Original Mortgage
$186,600
Interest Rate
5.75%
Mortgage Type
New Conventional
Create a Home Valuation Report for This Property
The Home Valuation Report is an in-depth analysis detailing your home's value as well as a comparison with similar homes in the area
Home Values in the Area
Average Home Value in this Area
Purchase History
| Date | Buyer | Sale Price | Title Company |
|---|---|---|---|
| Kazemi | -- | -- | |
| Kazemi | $263,000 | -- | |
| Huber Mark J | $237,000 | -- |
Source: Public Records
Mortgage History
| Date | Status | Borrower | Loan Amount |
|---|---|---|---|
| Closed | Kazemi | $192,000 | |
| Previous Owner | Huber Mark J | $186,600 |
Source: Public Records
Tax History Compared to Growth
Tax History
| Year | Tax Paid | Tax Assessment Tax Assessment Total Assessment is a certain percentage of the fair market value that is determined by local assessors to be the total taxable value of land and additions on the property. | Land | Improvement |
|---|---|---|---|---|
| 2025 | $2,382 | $330,720 | $80,760 | $249,960 |
| 2023 | $7,874 | $307,120 | $62,120 | $245,000 |
| 2022 | $2,393 | $232,840 | $47,120 | $185,720 |
| 2021 | $2,326 | $188,360 | $43,440 | $144,920 |
| 2020 | $4,856 | $179,760 | $30,960 | $148,800 |
| 2019 | $564 | $200,080 | $59,480 | $140,600 |
| 2018 | $5,373 | $195,400 | $58,080 | $137,320 |
| 2017 | $5,014 | $169,560 | $50,400 | $119,160 |
| 2016 | $5,272 | $169,560 | $50,400 | $119,160 |
| 2015 | $4,454 | $169,120 | $50,400 | $118,720 |
| 2014 | $4,799 | $149,120 | $44,440 | $104,680 |
Source: Public Records
Map
Nearby Homes
- 680 Evening Pine Ln
- 5735 Sunset Maple Dr
- 140 Ashewoode Downs Ln
- 7530 Newstead Dr
- 5650 Preserve Cir
- 640 Evening Pine Ln
- 7105 Brookwood Way
- 5635 Ashewoode Downs Dr
- 7170 Collingsworth Place
- 110 W Meadows Ct
- 3180 Caney Creek Ln
- 5440 Vicarage Walk
- 5510 Vicarage Walk
- 3585 Lakeheath Dr
- 7335 Lytham Trace
- 12470 Concord Hall Dr
- 5445 Preserve Cir
- 5425 Preserve Cir Unit 3B
- 5415 Preserve Cir Unit 3B
- 5455 Preserve Cir
- 5480 Preserve Cir Unit 3B
- 5470 Preserve Cir Unit 3B
- 5500 Preserve Cir
- 5405 Preserve Cir Unit 11
- 5465 Preserve Cir
- 12510 Preserve Ln
- 5855 Sunset Maple Dr
- 5475 Preserve Cir
- 5510 Preserve Cir
- 12500 Preserve Ln
- 5395 Preserve Cir
- 5800 Sunset Maple Dr
- 7835 Llangollen Way
- 5845 Sunset Maple Dr
- 12490 Preserve Ln
- 5520 Preserve Cir