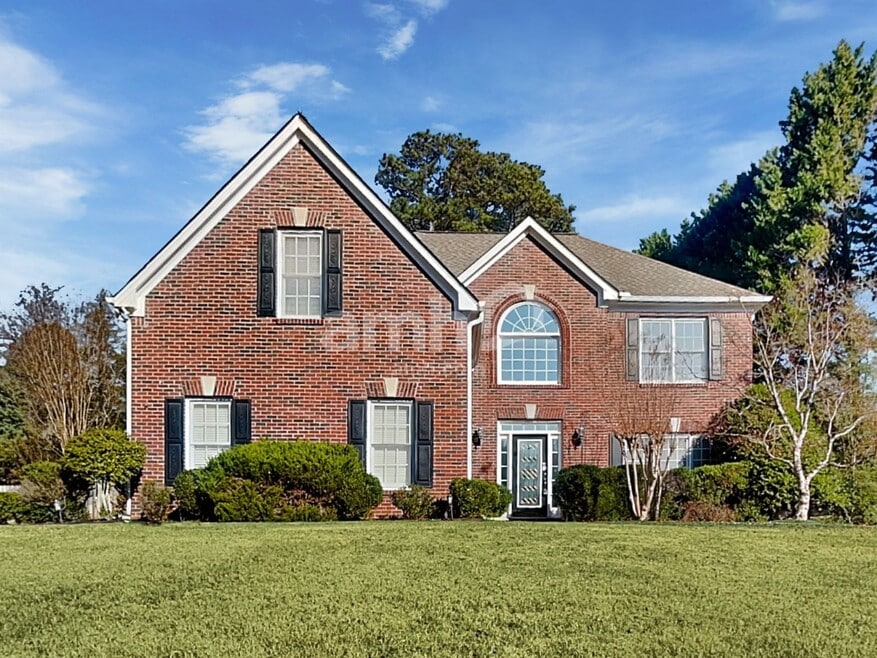
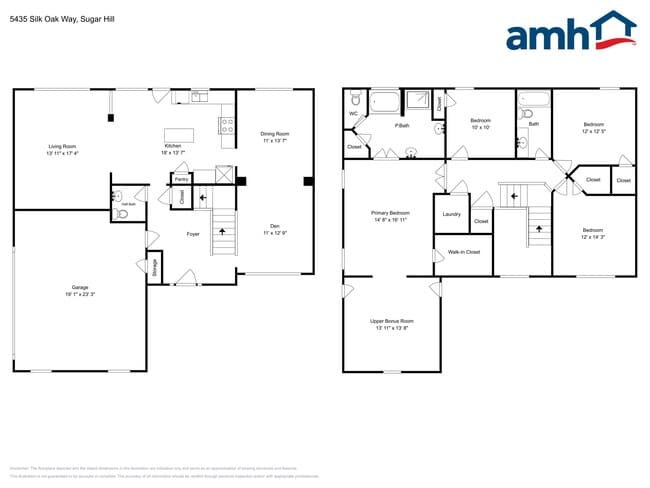
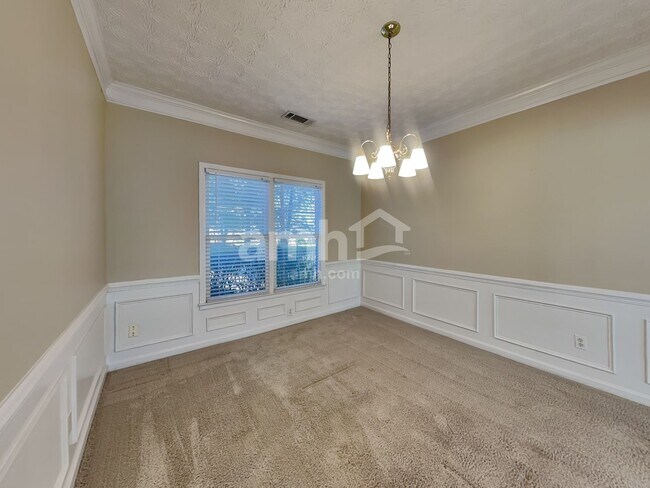
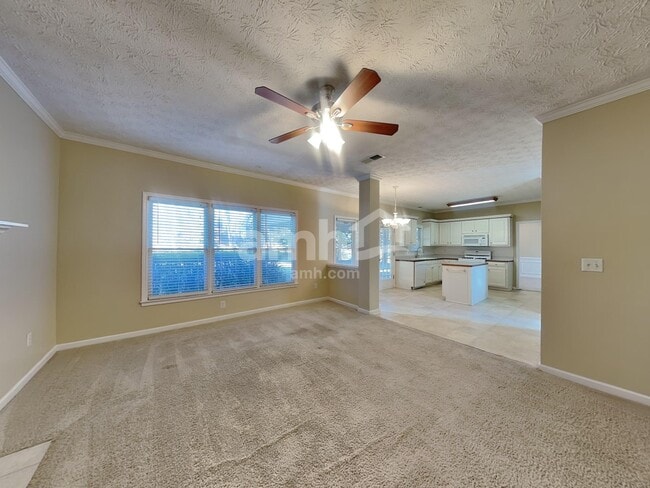
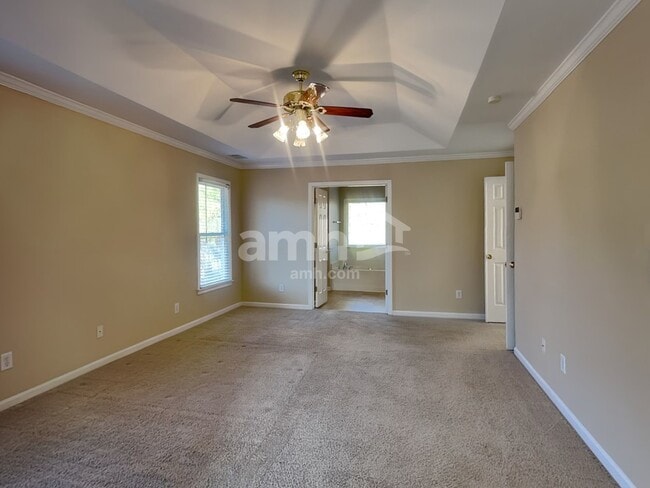
5435 Silk Oak Way Sugar Hill, GA 30518
About This Home
Special offer: Pay just 50% of your base rent (taxes and fees not included) as your security deposit, valid for new applicants who sign a 12-month lease by December 31, 2025. Offer is contingent on application approval and execution of a lease agreement. Other terms and conditions may apply. This property is professionally managed by AMH, a leading single-family rental company. We work to simplify your rental experience by offering self-guided tours and a streamlined leasing process you can complete all online, all on your own schedule. Once moved in, we provide maintenance support that you can rely on, so you can enjoy your weekends stress-free. We look forward to welcoming you home! See Today, Sign Today™ Take a self-guided tour of this property using our Let Yourself In® service to view the space on your own schedule, without an agent. And if your documents are in order, you might even view a home and sign a lease on the same day! Utilities, taxes, and other fees may apply. Please verify and confirm all information before signing a lease. If you have questions, don’t hesitate to contact us at the telephone number on this property listing. All lease applications, documentation, and initial payments for this property, must be submitted directly through or by phone. The photos, renderings, or other images of the properties on our website, are for illustrative purposes only, and may vary from the features, amenities, or phase of construction. We do not advertise properties on Craigslist, Facebook Marketplace, or other classified advertising websites. If you believe one of our residences is listed there, please notify us. For further description of applicable fees, please go to our website.

Map
Property History
| Date | Event | Price | List to Sale | Price per Sq Ft |
|---|---|---|---|---|
| 12/11/2025 12/11/25 | Price Changed | $2,430 | -1.0% | $1 / Sq Ft |
| 12/09/2025 12/09/25 | Price Changed | $2,455 | -0.4% | $1 / Sq Ft |
| 11/25/2025 11/25/25 | Price Changed | $2,465 | -1.6% | $1 / Sq Ft |
| 11/20/2025 11/20/25 | Price Changed | $2,505 | -1.6% | $1 / Sq Ft |
| 11/19/2025 11/19/25 | Price Changed | $2,545 | -0.6% | $1 / Sq Ft |
| 10/29/2025 10/29/25 | For Rent | $2,560 | -- | -- |
- 491 Sweetfern Ln
- 0 Rear Silk Oak Way
- 5422 Pepperbush Ct
- 581 Sweetfern Ln
- 5340 Candun Cir
- 5390 Regency Lake Ct
- 5431 Cumming Hwy NE
- 518 Bellingham Dr
- 561 Wagon Hill Ln
- 5381 Front Runner Ct
- 289 Somerset Rose Ln
- 779 Avonley Creek Trace
- 259 Somerset Rose Ln
- 5510 Brighton Rose Ln
- 5828 Paliser Trace
- 5720 Emerald Falls Way
- 534 Emerald Lake Ln Unit 4
- 870 Long Branch Cir
- 5855 Lenox Park Place
- 850 Long Branch Cir
- 283 Grand Ashbury Ln
- 330 La Perla Dr
- 5212 Pine Branch Cir
- 613 Friars Head Ct
- 5119 Shelley Ln
- 5229 Pine Branch Ct
- 745 Friars Head Dr NE
- 888 Saddlebred Way
- 270 Pasatiempo Ln
- 800 Johnson Mill Terrace
- 5630 Saltcreek Place
- 4995 Bent Creek Ct
- 5868 Valine Way
- 5134 Belmore Manor Ct Unit 1
- 5135 Thorin Oak Cir
- 5495 Sugar Crossing Dr
- 722 Level Creek Rd
- 4987 Rustic Canyon Dr
- 738 Austin Creek Dr
- 1081 Shelby Lynn Ct