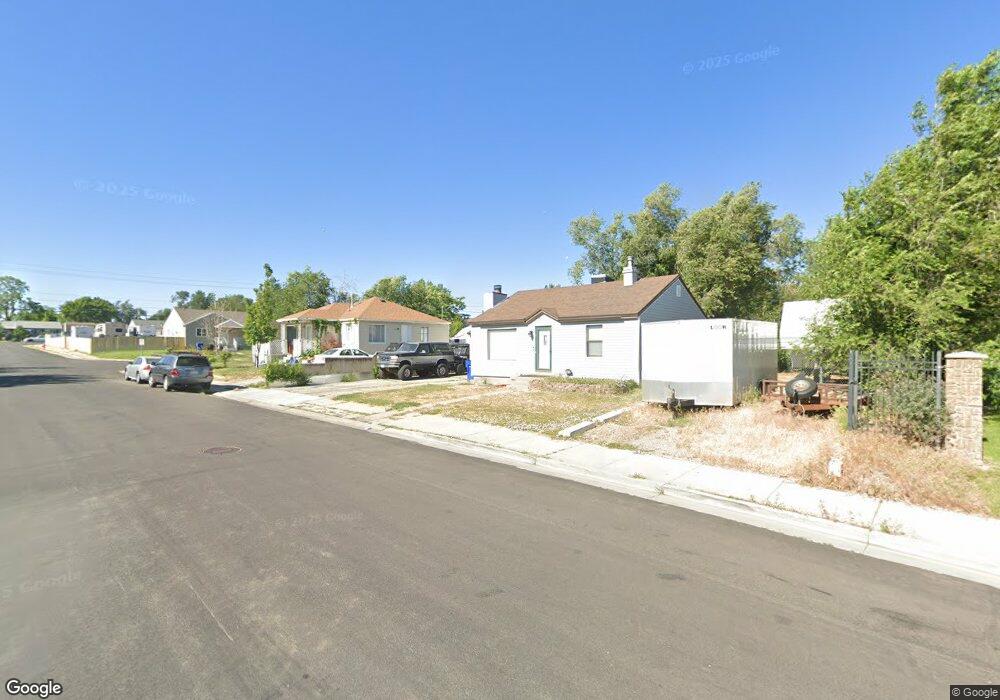
5436 S 4320 W Salt Lake City, UT 84118
Estimated Value: $361,000 - $417,000
4
Beds
2
Baths
2,121
Sq Ft
$188/Sq Ft
Est. Value
About This Home
This home is located at 5436 S 4320 W, Salt Lake City, UT 84118 and is currently estimated at $399,387, approximately $188 per square foot. 5436 S 4320 W is a home located in Salt Lake County with nearby schools including South Kearns Elementary School, Kearns Jr High School, and Kearns High School.
Ownership History
Date
Name
Owned For
Owner Type
Purchase Details
Closed on
Sep 23, 2005
Sold by
Stanley Elizabeth P and Stanley Jordan B
Bought by
Stanley Jordan B and Stanley Elizabeth P
Current Estimated Value
Home Financials for this Owner
Home Financials are based on the most recent Mortgage that was taken out on this home.
Original Mortgage
$29,200
Interest Rate
5.33%
Mortgage Type
Stand Alone Second
Purchase Details
Closed on
Aug 21, 2002
Sold by
Ashcraft Elizabeth and Witkamp Catharina
Bought by
Ashcraft Elizabeth and Stanley Jordan B
Purchase Details
Closed on
Apr 24, 2001
Sold by
Winkler Ulrich J and Winkler Geraldine
Bought by
Ashcraft Elizabeth and Witkamp Catharina
Home Financials for this Owner
Home Financials are based on the most recent Mortgage that was taken out on this home.
Original Mortgage
$121,910
Interest Rate
6.98%
Mortgage Type
FHA
Create a Home Valuation Report for This Property
The Home Valuation Report is an in-depth analysis detailing your home's value as well as a comparison with similar homes in the area
Home Values in the Area
Average Home Value in this Area
Purchase History
| Date | Buyer | Sale Price | Title Company |
|---|---|---|---|
| Stanley Jordan B | -- | Meridian Title | |
| Ashcraft Elizabeth | -- | -- | |
| Ashcraft Elizabeth | -- | -- |
Source: Public Records
Mortgage History
| Date | Status | Borrower | Loan Amount |
|---|---|---|---|
| Closed | Stanley Jordan B | $29,200 | |
| Open | Stanley Jordan B | $116,800 | |
| Closed | Ashcraft Elizabeth | $121,910 |
Source: Public Records
Tax History Compared to Growth
Tax History
| Year | Tax Paid | Tax Assessment Tax Assessment Total Assessment is a certain percentage of the fair market value that is determined by local assessors to be the total taxable value of land and additions on the property. | Land | Improvement |
|---|---|---|---|---|
| 2025 | $2,432 | $310,300 | $86,100 | $224,200 |
| 2024 | $2,432 | $290,700 | $80,900 | $209,800 |
| 2023 | $2,306 | $265,300 | $77,700 | $187,600 |
| 2022 | $2,328 | $277,500 | $76,300 | $201,200 |
| 2021 | $2,165 | $231,600 | $58,700 | $172,900 |
| 2020 | $2,021 | $201,000 | $50,500 | $150,500 |
| 2019 | $2,010 | $200,200 | $47,600 | $152,600 |
| 2018 | $2,001 | $188,900 | $47,600 | $141,300 |
| 2017 | $1,660 | $163,200 | $47,600 | $115,600 |
| 2016 | $1,413 | $136,000 | $43,900 | $92,100 |
| 2015 | $1,371 | $122,100 | $53,500 | $68,600 |
| 2014 | $1,199 | $111,700 | $49,700 | $62,000 |
Source: Public Records
Map
Nearby Homes