Estimated Value: $162,000 - $223,000
3
Beds
2
Baths
1,512
Sq Ft
$123/Sq Ft
Est. Value
About This Home
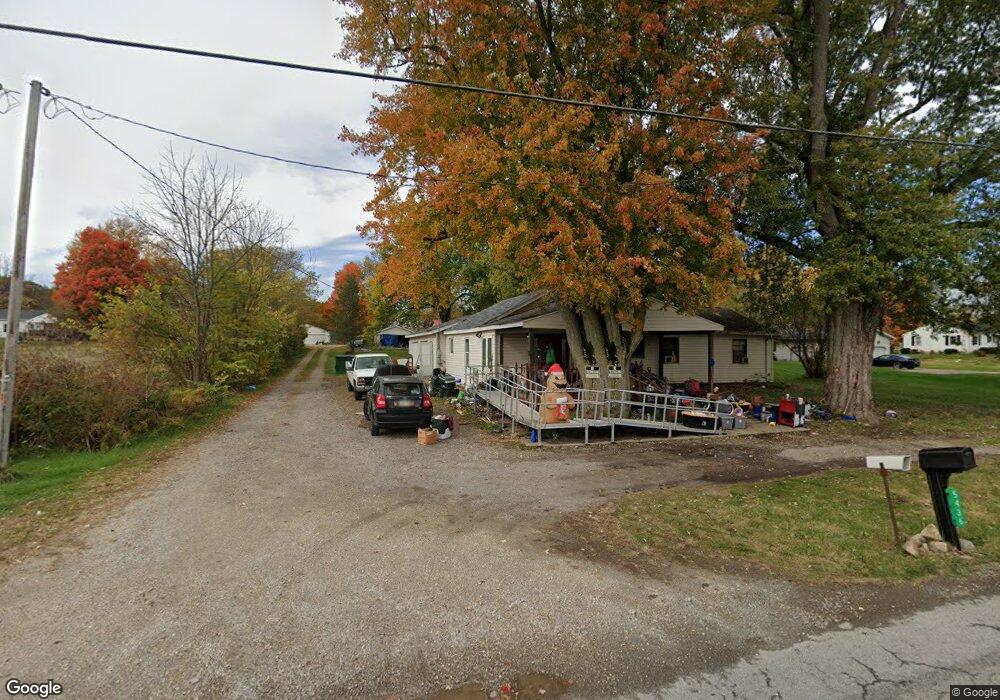
This home is located at 5436 Saint Johns Rd, Lima, OH 45806 and is currently estimated at $186,152, approximately $123 per square foot. 5436 Saint Johns Rd is a home located in Allen County with nearby schools including Perry Elementary School and Perry High School.
Ownership History
Date
Name
Owned For
Owner Type
Purchase Details
Closed on
Sep 30, 2024
Sold by
Anderson Emmaline R
Bought by
Vanvoorhis Bryan A
Current Estimated Value
Purchase Details
Closed on
Jun 2, 2018
Sold by
Neu Robert W and Neu Andrea L
Bought by
Voorhis Bryan A Van
Home Financials for this Owner
Home Financials are based on the most recent Mortgage that was taken out on this home.
Original Mortgage
$70,000
Interest Rate
3.5%
Mortgage Type
Land Contract Argmt. Of Sale
Purchase Details
Closed on
Sep 27, 1996
Sold by
Neu Judith
Bought by
Neu Robert and Neu Andrea
Home Financials for this Owner
Home Financials are based on the most recent Mortgage that was taken out on this home.
Original Mortgage
$16,200
Interest Rate
7.97%
Mortgage Type
New Conventional
Purchase Details
Closed on
Feb 16, 1989
Bought by
Hover Diana
Create a Home Valuation Report for This Property
The Home Valuation Report is an in-depth analysis detailing your home's value as well as a comparison with similar homes in the area
Purchase History
| Date | Buyer | Sale Price | Title Company |
|---|---|---|---|
| Vanvoorhis Bryan A | -- | None Listed On Document | |
| Voorhis Bryan A Van | $70,001 | None Available | |
| Neu Robert | $26,000 | -- | |
| Hover Diana | -- | -- |
Source: Public Records
Mortgage History
| Date | Status | Borrower | Loan Amount |
|---|---|---|---|
| Previous Owner | Voorhis Bryan A Van | $70,000 | |
| Previous Owner | Neu Robert | $16,200 |
Source: Public Records
Tax History
| Year | Tax Paid | Tax Assessment Tax Assessment Total Assessment is a certain percentage of the fair market value that is determined by local assessors to be the total taxable value of land and additions on the property. | Land | Improvement |
|---|---|---|---|---|
| 2024 | $1,710 | $44,280 | $6,860 | $37,420 |
| 2023 | $1,563 | $36,900 | $5,710 | $31,190 |
| 2022 | $1,581 | $36,900 | $5,710 | $31,190 |
| 2021 | $1,573 | $36,900 | $5,710 | $31,190 |
| 2020 | $1,419 | $30,660 | $5,180 | $25,480 |
| 2019 | $1,419 | $30,660 | $5,180 | $25,480 |
| 2018 | $1,341 | $30,660 | $5,180 | $25,480 |
| 2017 | $1,302 | $28,460 | $5,180 | $23,280 |
| 2016 | $1,296 | $28,460 | $5,180 | $23,280 |
| 2015 | $1,210 | $28,460 | $5,180 | $23,280 |
| 2014 | $1,210 | $26,290 | $5,180 | $21,110 |
| 2013 | $1,297 | $26,290 | $5,180 | $21,110 |
Source: Public Records
Map
Nearby Homes
- St Johns Rd
- 17946 National Rd
- 3828 Saint Johns Rd
- 1200 E Breese Rd
- 3700 Greely Chapel Rd
- 106 S Oak St
- 1643 W Breese Rd Unit 73
- 2500 Greely Chapel Rd
- 2035 Maplewood Ln
- 0 E 13th St
- 106 E 13th St
- 0000 E 13th St
- 000 E 13th St
- 00 E 12th St
- 000 E 12th St
- 322 Lavina Ave
- 0 E 12th St
- 122 E 12th St
- 2613 Jonathon Dr
- 0 Harding Hwy Unit 307187
Your Personal Tour Guide
Ask me questions while you tour the home.