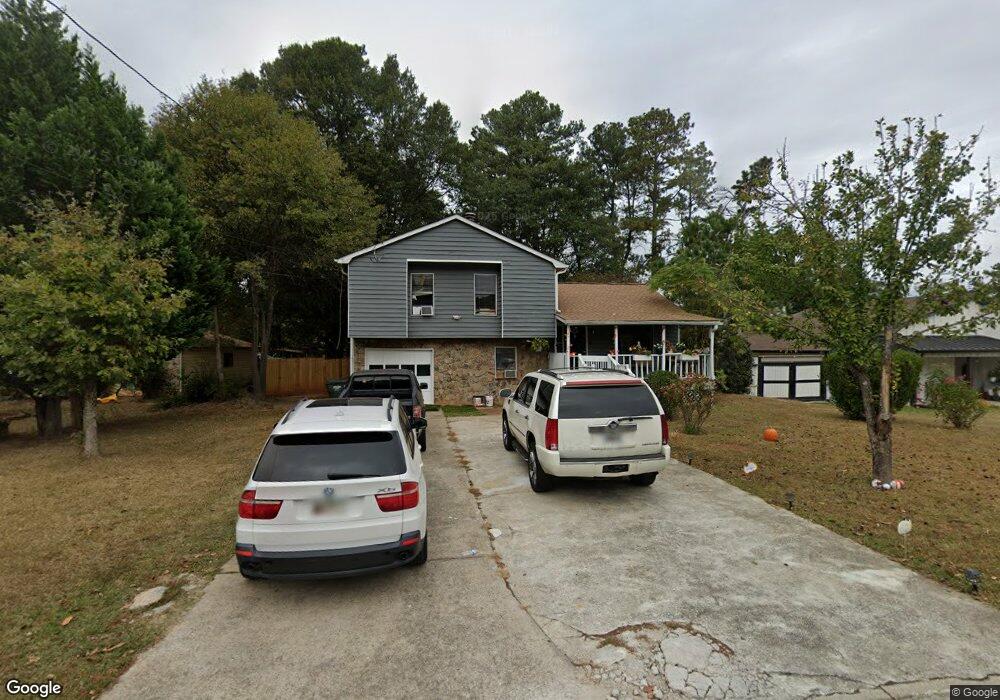
5437 Ashington Ct Norcross, GA 30071
Estimated Value: $313,064 - $338,000
3
Beds
2
Baths
1,080
Sq Ft
$303/Sq Ft
Est. Value
About This Home
This home is located at 5437 Ashington Ct, Norcross, GA 30071 and is currently estimated at $327,266, approximately $303 per square foot. 5437 Ashington Ct is a home located in Gwinnett County with nearby schools including Norcross Elementary School, Summerour Middle School, and Norcross High School.
Ownership History
Date
Name
Owned For
Owner Type
Purchase Details
Closed on
Jun 15, 2021
Sold by
Sayar Fidaa
Bought by
Beaver Ruin Rentals Llc
Current Estimated Value
Purchase Details
Closed on
Aug 28, 2008
Sold by
Hud & Housing Of Urban Dev
Bought by
Sayar Sam and Sayar Fidaa
Home Financials for this Owner
Home Financials are based on the most recent Mortgage that was taken out on this home.
Original Mortgage
$63,280
Interest Rate
6.21%
Mortgage Type
New Conventional
Purchase Details
Closed on
Nov 6, 2007
Sold by
Wells Fargo Bank Na
Bought by
Hud-Housing Of Urban Dev
Purchase Details
Closed on
Jul 16, 1998
Sold by
Bethea Kerry J and Bethea Loleta
Bought by
Segura Jose A
Home Financials for this Owner
Home Financials are based on the most recent Mortgage that was taken out on this home.
Original Mortgage
$91,700
Interest Rate
6.97%
Mortgage Type
FHA
Create a Home Valuation Report for This Property
The Home Valuation Report is an in-depth analysis detailing your home's value as well as a comparison with similar homes in the area
Home Values in the Area
Average Home Value in this Area
Purchase History
| Date | Buyer | Sale Price | Title Company |
|---|---|---|---|
| Beaver Ruin Rentals Llc | -- | -- | |
| Sayar Sam | $79,100 | -- | |
| Hud-Housing Of Urban Dev | -- | -- | |
| Wells Fargo Bank Na | $133,220 | -- | |
| Segura Jose A | $92,900 | -- |
Source: Public Records
Mortgage History
| Date | Status | Borrower | Loan Amount |
|---|---|---|---|
| Previous Owner | Sayar Sam | $63,280 | |
| Previous Owner | Segura Jose A | $91,700 |
Source: Public Records
Tax History Compared to Growth
Tax History
| Year | Tax Paid | Tax Assessment Tax Assessment Total Assessment is a certain percentage of the fair market value that is determined by local assessors to be the total taxable value of land and additions on the property. | Land | Improvement |
|---|---|---|---|---|
| 2025 | $3,169 | $118,000 | $21,600 | $96,400 |
| 2024 | $1,805 | $131,520 | $21,600 | $109,920 |
| 2023 | $1,805 | $56,400 | $14,840 | $41,560 |
| 2022 | $1,539 | $56,400 | $14,840 | $41,560 |
| 2021 | $1,181 | $72,040 | $14,840 | $57,200 |
| 2020 | $1,190 | $36,000 | $10,000 | $26,000 |
| 2019 | $1,652 | $36,000 | $10,000 | $26,000 |
| 2018 | $1,013 | $30,600 | $8,500 | $22,100 |
| 2016 | $582 | $17,600 | $8,000 | $9,600 |
| 2015 | $887 | $17,600 | $8,000 | $9,600 |
| 2014 | -- | $14,960 | $6,800 | $8,160 |
Source: Public Records
Map
Nearby Homes
- 2199 Summertown Dr
- 5341 Goodwick Way
- 5477 Windy Creek Ln
- 5479 Windy Creek Ln
- 5457 Rails Way
- 2375 Beaver Falls Dr
- 5381 Station Cir Unit 3
- 5364 Hickory Knoll
- 5358 Beaver Branch
- 5357 Beaver Branch
- 2340 Beaver Ruin Rd Unit 26
- 2340 Beaver Ruin Rd Unit 41
- 2340 Beaver Ruin Rd
- 2340 Beaver Ruin Rd Unit 15
- 2340 Beaver Ruin Rd Unit 16
- 2009 Hoot Owl Trail
- 5645 Hammond Dr
- 5639 Chatham Cir
- 4242 Morrison Lake Trail
- 5206 Westhill Dr NW
- 5447 Ashington Ct Unit 1
- 5427 Ashington Ct
- 2202 Huddersfield Way Unit 1
- 2223 New Castle Cir
- 2213 New Castle Cir
- 5457 Ashington Ct
- 5436 Ashington Ct
- 2183 Huddersfield Way Unit 1
- 2173 Huddersfield Way
- 2212 Huddersfield Way Unit 1
- 5426 Ashington Ct Unit 1
- 5446 Ashington Ct
- 5467 Ashington Ct Unit 1
- 2222 Huddersfield Way Unit 1
- 2222 New Castle Cir Unit 1
- 5456 Ashington Ct Unit 1
- 2233 New Castle Cir
- 5466 Ashington Ct Unit 1
- 2193 Huddersfield Way
- 2223 Huddersfield Way Unit 1