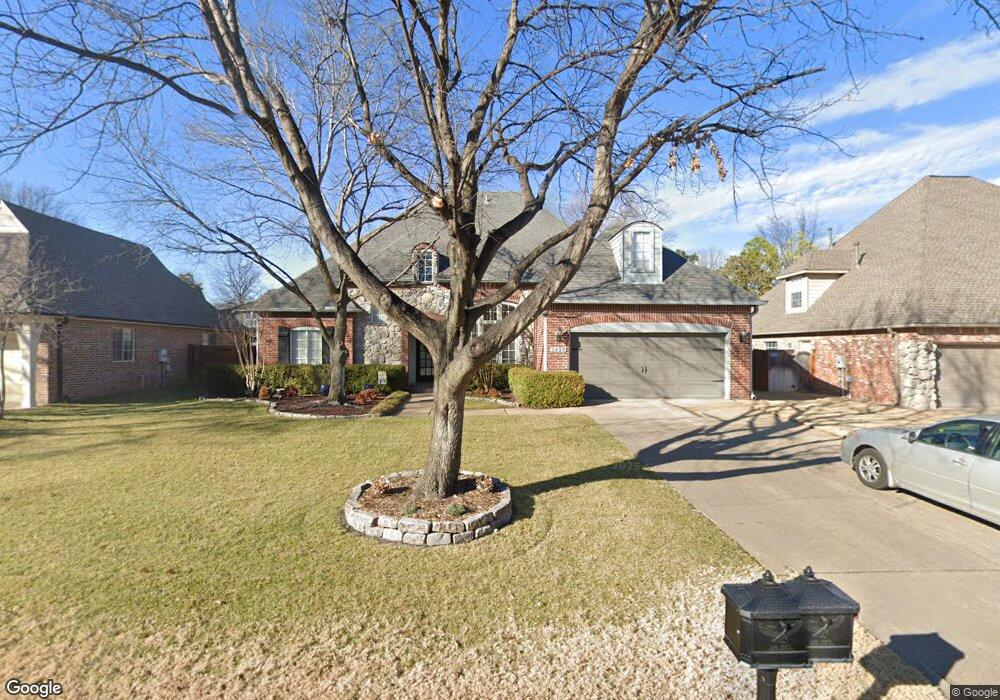
5437 E 110th St Tulsa, OK 74137
Knollwood Estates NeighborhoodEstimated Value: $440,000 - $557,000
4
Beds
4
Baths
3,308
Sq Ft
$153/Sq Ft
Est. Value
About This Home
This home is located at 5437 E 110th St, Tulsa, OK 74137 and is currently estimated at $505,357, approximately $152 per square foot. 5437 E 110th St is a home located in Tulsa County with nearby schools including Southeast Elementary School, Jenks Middle School, and Jenks East Intermediate Elementary School.
Ownership History
Date
Name
Owned For
Owner Type
Purchase Details
Closed on
Jan 13, 2014
Sold by
Litz Angel C
Bought by
Litz Kevin Y
Current Estimated Value
Purchase Details
Closed on
Nov 30, 2006
Sold by
Robison Dustin and Robison Lisa
Bought by
Litz Kevin Y
Purchase Details
Closed on
Nov 4, 2003
Sold by
Wells Fargo Bank Minnesota Na
Bought by
Robinson Dustin
Purchase Details
Closed on
Mar 26, 2003
Sold by
Wilson Stephen Lynn and Shindler Gregory Sean
Bought by
Wells Fargo Bank Minnesota Na and Delta Home Equity Loan Trust
Purchase Details
Closed on
Jun 1, 1998
Sold by
Bank Of America Illinois
Bought by
Shindler Gregory Sean and Wilson Stephanie Lynn
Purchase Details
Closed on
Dec 9, 1997
Sold by
Glanz Stanley and Chitwood Jane A
Bought by
Bank Of America Illinois
Create a Home Valuation Report for This Property
The Home Valuation Report is an in-depth analysis detailing your home's value as well as a comparison with similar homes in the area
Home Values in the Area
Average Home Value in this Area
Purchase History
| Date | Buyer | Sale Price | Title Company |
|---|---|---|---|
| Litz Kevin Y | -- | None Available | |
| Litz Kevin Y | $300,500 | None Available | |
| Robinson Dustin | $243,000 | -- | |
| Wells Fargo Bank Minnesota Na | -- | -- | |
| Shindler Gregory Sean | $235,000 | Guaranty Abstract Company | |
| Bank Of America Illinois | -- | -- |
Source: Public Records
Tax History
| Year | Tax Paid | Tax Assessment Tax Assessment Total Assessment is a certain percentage of the fair market value that is determined by local assessors to be the total taxable value of land and additions on the property. | Land | Improvement |
|---|---|---|---|---|
| 2025 | $5,410 | $38,266 | $6,237 | $32,029 |
| 2024 | $4,795 | $37,123 | $6,242 | $30,881 |
| 2023 | $4,795 | $37,012 | $6,146 | $30,866 |
| 2022 | $4,796 | $34,934 | $8,162 | $26,772 |
| 2021 | $4,717 | $33,887 | $7,917 | $25,970 |
| 2020 | $4,617 | $33,887 | $7,917 | $25,970 |
| 2019 | $4,774 | $33,887 | $7,917 | $25,970 |
| 2018 | $4,771 | $33,887 | $7,917 | $25,970 |
| 2017 | $4,658 | $34,887 | $8,151 | $26,736 |
| 2016 | $4,677 | $34,887 | $8,151 | $26,736 |
| 2015 | $4,647 | $34,887 | $8,151 | $26,736 |
| 2014 | $4,495 | $33,055 | $8,151 | $24,904 |
Source: Public Records
Map
Nearby Homes
- 5711 E 110th Place
- 11018 S Erie Ave
- 5510 E 107th St
- 5535 E 113th St
- 5140 E 107th Place
- 5118 E 108th St
- 5929 E 109th St
- 5111 E 108th St
- 5141 E 107th St
- 10617 S Winston Ct
- 11503 S Granite Ave
- 3829 E 103rd Place
- 6509 E 109th Place S
- 10617 S Oxford Ave
- 4912 E 104th Place
- 11202 S 66th East Ave
- 4801 E 112th Place
- 10775 S Sheridan Rd
- 6308 E 105th St
- 6619 E 109th St
- 5433 E 110th St
- 5441 E 110th St
- 5434 E 109th Place
- 5430 E 109th Place
- 5429 E 110th St
- 5445 E 110th St
- 5436 E 110th St
- 5432 E 110th St
- 5426 E 109th Place
- 5440 E 110th St
- 5442 E 109th Place
- 5425 E 110th St
- 5449 E 110th St
- 5428 E 110th St
- 5446 E 110th St
- 5501 E 110th St
- 5422 E 109th Place
- 5446 E 109th Place
- 5424 E 110th St
- 5450 E 110th St
Your Personal Tour Guide
Ask me questions while you tour the home.