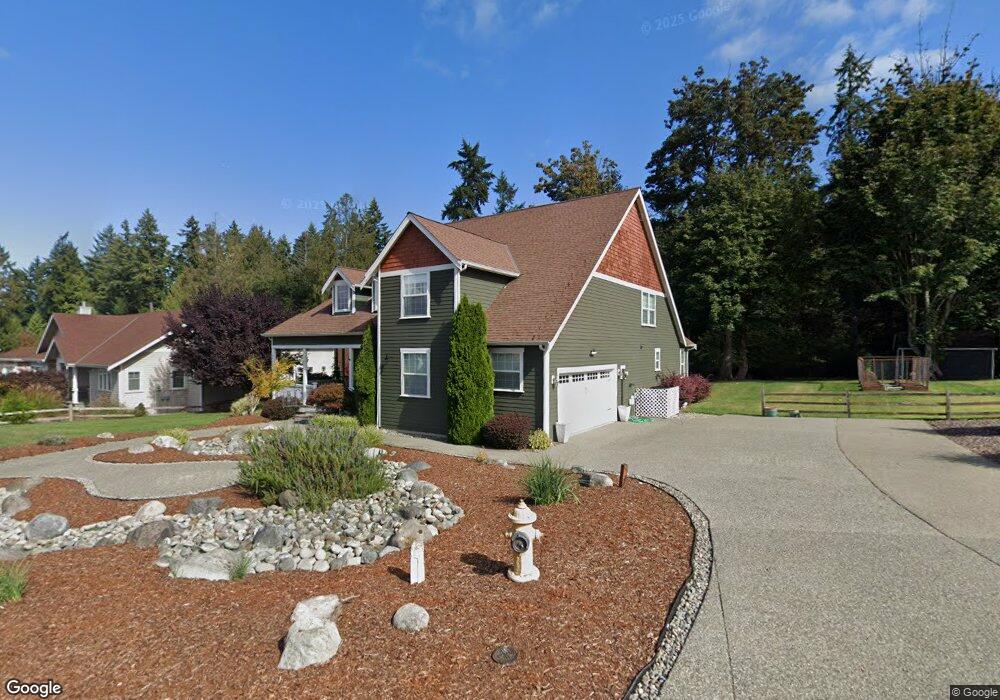
5438 E Blaisdell Ln Port Orchard, WA 98366
Estimated Value: $872,779 - $958,000
3
Beds
3
Baths
2,916
Sq Ft
$317/Sq Ft
Est. Value
About This Home
This home is located at 5438 E Blaisdell Ln, Port Orchard, WA 98366 and is currently estimated at $923,945, approximately $316 per square foot. 5438 E Blaisdell Ln is a home located in Kitsap County with nearby schools including Orchard Heights Elementary School, Marcus Whitman Middle School, and South Kitsap High School.
Ownership History
Date
Name
Owned For
Owner Type
Purchase Details
Closed on
Mar 25, 2020
Sold by
Cook Lemus Nancy Ann and Cook Lemus Trust
Bought by
Cook Lemus Nancy
Current Estimated Value
Purchase Details
Closed on
Sep 22, 2014
Sold by
Gentle Renee A and Gentle Kenneth
Bought by
Cook Lemus Trust and Cook Lemus Nancy A
Purchase Details
Closed on
May 5, 2011
Sold by
Turner Cristopher D and Turner Michele L
Bought by
Tiffany Renee A and Gentle Kenneth
Home Financials for this Owner
Home Financials are based on the most recent Mortgage that was taken out on this home.
Original Mortgage
$345,800
Interest Rate
4.84%
Mortgage Type
New Conventional
Purchase Details
Closed on
Jun 16, 2004
Sold by
Jefferson Properties Inc
Bought by
Turner Cristopher D and Turner Michele L
Home Financials for this Owner
Home Financials are based on the most recent Mortgage that was taken out on this home.
Original Mortgage
$268,000
Interest Rate
6.27%
Mortgage Type
Purchase Money Mortgage
Create a Home Valuation Report for This Property
The Home Valuation Report is an in-depth analysis detailing your home's value as well as a comparison with similar homes in the area
Home Values in the Area
Average Home Value in this Area
Purchase History
| Date | Buyer | Sale Price | Title Company |
|---|---|---|---|
| Cook Lemus Nancy | -- | None Available | |
| Cook Lemus Trust | $395,000 | Stewart Title | |
| Tiffany Renee A | $364,280 | Pacific Nw Title | |
| Turner Cristopher D | $335,000 | Transnation Title |
Source: Public Records
Mortgage History
| Date | Status | Borrower | Loan Amount |
|---|---|---|---|
| Previous Owner | Tiffany Renee A | $345,800 | |
| Previous Owner | Turner Cristopher D | $268,000 | |
| Closed | Turner Cristopher D | $50,250 |
Source: Public Records
Tax History Compared to Growth
Tax History
| Year | Tax Paid | Tax Assessment Tax Assessment Total Assessment is a certain percentage of the fair market value that is determined by local assessors to be the total taxable value of land and additions on the property. | Land | Improvement |
|---|---|---|---|---|
| 2026 | $6,454 | $751,490 | $113,860 | $637,630 |
| 2025 | $6,454 | $751,490 | $113,860 | $637,630 |
| 2024 | $6,258 | $751,490 | $113,860 | $637,630 |
| 2023 | $6,215 | $751,490 | $113,860 | $637,630 |
| 2022 | $5,953 | $602,090 | $91,260 | $510,830 |
| 2021 | $5,679 | $543,410 | $86,920 | $456,490 |
| 2020 | $5,823 | $541,510 | $83,630 | $457,880 |
| 2019 | $5,005 | $512,230 | $78,870 | $433,360 |
| 2018 | $5,244 | $401,180 | $71,390 | $329,790 |
| 2017 | $4,323 | $401,180 | $71,390 | $329,790 |
| 2016 | $4,517 | $384,150 | $67,990 | $316,160 |
| 2015 | $4,146 | $356,890 | $67,990 | $288,900 |
| 2014 | -- | $327,990 | $48,950 | $279,040 |
| 2013 | -- | $327,990 | $48,950 | $279,040 |
Source: Public Records
Map
Nearby Homes
- 5396 E Blaisdell Ln
- 4429 Waterman Ridge Ln E
- 5675 E Hillcrest Dr
- 3643 Beach Dr E
- 3538 Beach Dr E
- 3193 Woods Rd E
- 0 Nevada Ave & Michigan St Unit NWM2365944
- 3200 Nevada East Ave
- 22 Lots Ave
- 7021 Beach Dr E
- 6997 E Bullseye St
- 7016 E Nightingale St
- 7020 E Nightingale St
- 6754 Missouri St E
- 7057 E Bullseye St
- 7058 E Nightingale St
- 7081 E Bullseye St
- 5172 Rich View Dr E
- 7000 E Dakota St
- 7817 E Hilldale Rd
- 5432 E Blaisdell Rd
- 5444 E Blaisdell Ln
- 5444 E Blaisdell Rd
- 5445 E Blaisdell Ln
- 5445 E Blaisdell Ln
- 5439 E Blaisdell Ln
- 5439 E Blaisdell Ln
- 5426 E Blaisdell Rd
- 5451 E Blaisdell Ln
- 5451 E Blaisdell Rd
- 5420 E Blaisdell Ln
- 5420 E Blaisdell Rd
- 5457 E Blaisdell Ln
- 5450 E Blaisdell Rd
- 5427 E Blaisdell Rd
- 5457 E Blaisdell Rd
- 5414 E Blaisdell Ln
- 5414 E Blaisdell Rd
- 5377 E Blaisdell Rd