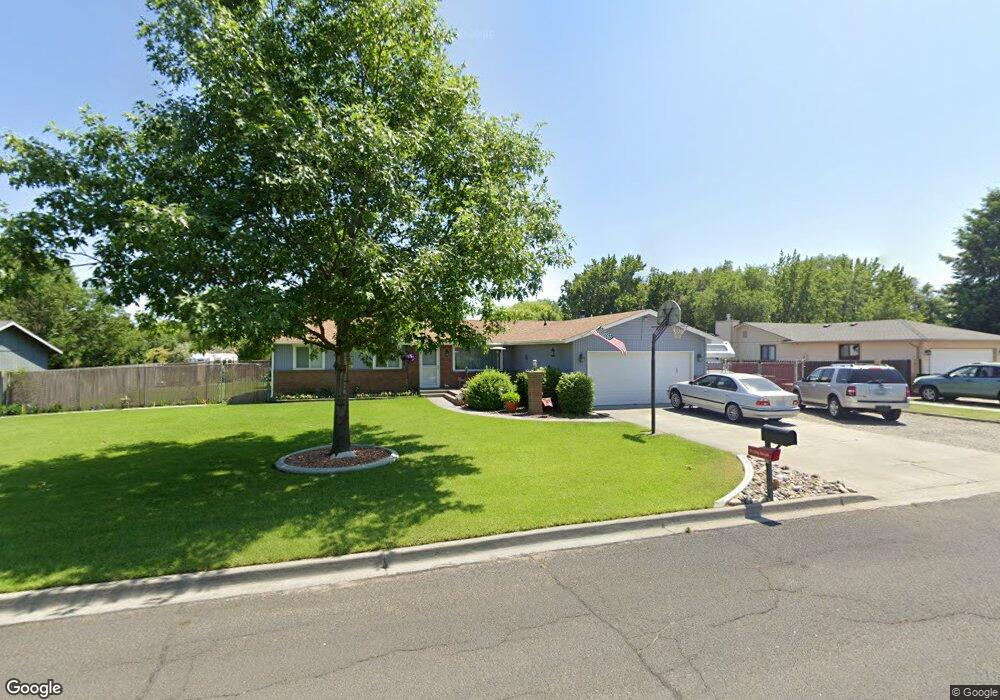
5438 Fern Loop West Richland, WA 99353
Estimated Value: $364,544 - $430,000
3
Beds
2
Baths
1,392
Sq Ft
$286/Sq Ft
Est. Value
About This Home
This home is located at 5438 Fern Loop, West Richland, WA 99353 and is currently estimated at $398,386, approximately $286 per square foot. 5438 Fern Loop is a home located in Benton County with nearby schools including Tapteal Elementary School, Hanford High School, and Liberty Christian School of the Tri-Cities.
Ownership History
Date
Name
Owned For
Owner Type
Purchase Details
Closed on
Jan 24, 2008
Sold by
Fox Michael L and Fox Barbara J
Bought by
Grayson Franklin D and Grayson Bethany R
Current Estimated Value
Home Financials for this Owner
Home Financials are based on the most recent Mortgage that was taken out on this home.
Original Mortgage
$142,000
Outstanding Balance
$89,306
Interest Rate
6.09%
Mortgage Type
Purchase Money Mortgage
Estimated Equity
$309,080
Create a Home Valuation Report for This Property
The Home Valuation Report is an in-depth analysis detailing your home's value as well as a comparison with similar homes in the area
Home Values in the Area
Average Home Value in this Area
Purchase History
| Date | Buyer | Sale Price | Title Company |
|---|---|---|---|
| Grayson Franklin D | $142,000 | Chicago Title |
Source: Public Records
Mortgage History
| Date | Status | Borrower | Loan Amount |
|---|---|---|---|
| Open | Grayson Franklin D | $142,000 |
Source: Public Records
Tax History Compared to Growth
Tax History
| Year | Tax Paid | Tax Assessment Tax Assessment Total Assessment is a certain percentage of the fair market value that is determined by local assessors to be the total taxable value of land and additions on the property. | Land | Improvement |
|---|---|---|---|---|
| 2024 | $3,576 | $285,660 | $40,000 | $245,660 |
| 2023 | $3,576 | $310,860 | $40,000 | $270,860 |
| 2022 | $2,829 | $228,970 | $40,000 | $188,970 |
| 2021 | $2,676 | $210,070 | $40,000 | $170,070 |
| 2020 | $2,768 | $191,180 | $40,000 | $151,180 |
| 2019 | $1,945 | $191,180 | $40,000 | $151,180 |
| 2018 | $2,139 | $139,300 | $32,000 | $107,300 |
| 2017 | $1,908 | $135,080 | $32,000 | $103,080 |
| 2016 | $1,816 | $135,080 | $32,000 | $103,080 |
| 2015 | $1,838 | $135,080 | $32,000 | $103,080 |
| 2014 | -- | $135,080 | $32,000 | $103,080 |
| 2013 | -- | $135,080 | $32,000 | $103,080 |
Source: Public Records
Map
Nearby Homes
- 5433 Fern Loop
- 5604 Echo St
- 70205 Ridge Rd
- Lot 3 Belmont Blvd
- Lot 2 Belmont Blvd
- 3173 Belmont Blvd
- 5404 Collins Rd
- 595 N 60th Ave
- 5880 S 58th Ave
- 961 N 60th Ave
- 1082 N 61st Ave
- 5120 Collins Rd
- 8 Crown Drive Private
- 5900 Everett St
- 302 Tumbleweed Ct
- NKA E Grover Prairie NE
- 6334 Hove St
- 393 S 41st Ave
- 8 Royal Crest Loop
- 6408 Haag St
